Introduction
Adobe Inc. was founded in 1982 by John Warnock and Charles Geschke in San Jose, California, where it remains headquartered today. For more than four decades, Adobe has been synonymous with digital creativity — the company behind Photoshop, Illustrator, Acrobat, and the PDF format, tools that have become part of the daily vocabulary of designers, photographers, filmmakers, and marketing professionals worldwide.
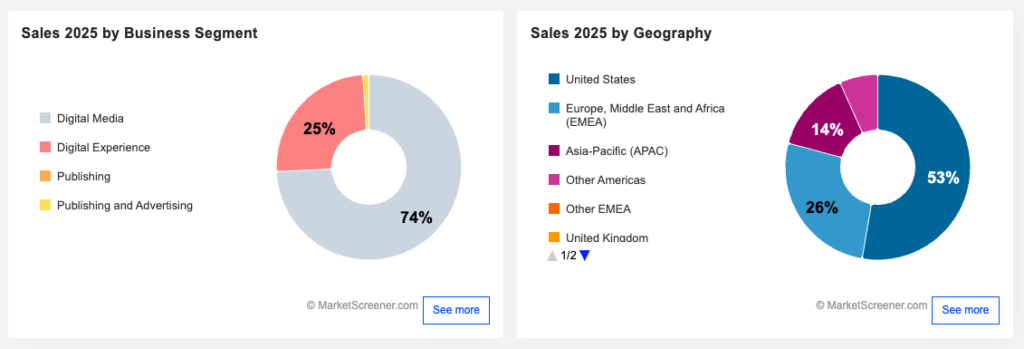
Adobe’s business serves two main customer groups, each with distinct product Adobe’s business is organized around three reportable segments:
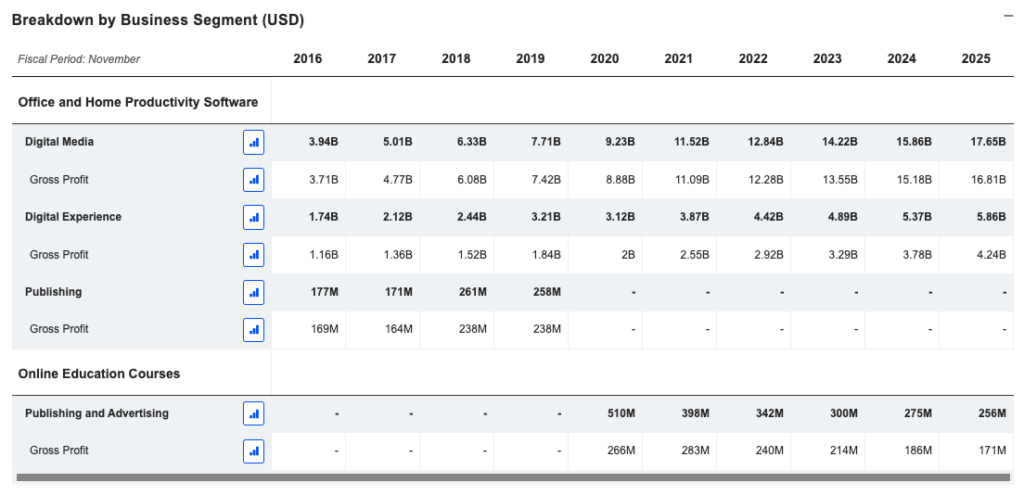
Digital Media ($17.65B, 74% of FY2025 revenue, +11% YoY). The core historical business. Includes Creative Cloud (Photoshop, Illustrator, Premiere Pro, After Effects, InDesign, and 20+ additional apps) and Document Cloud (Acrobat, PDF tools, Acrobat AI Assistant). Digital Media ARR exited FY2025 at $19.20B (+11.5% YoY). Express is used in 99% of US Fortune 500 companies.
Digital Experience ($5.86B, 25% of FY2025 revenue, +9% YoY). Adobe’s enterprise marketing and analytics division. Includes Adobe Experience Platform (AEP), GenStudio, Adobe Experience Manager (AEM), and related solutions. Competes with Salesforce, Oracle, and SAP in the customer experience management market. Digital Experience subscription revenue grew 11% YoY in FY2025 to $5.41B. AEP subscription revenue grew over 30% YoY in Q1 FY2026.
Print & Publishing ($0.26B, 1% of FY2025 revenue, -7% YoY). A residual legacy segment including PostScript licensing and related technologies. Structurally declining and economically immaterial. Not a strategic consideration for the investment thesis.tools — a broader and faster-evolving competitive landscape than many investors appreciate.
The Subscription Pivot
To understand Adobe as an investment, you need to understand the boldest decision in its history: in 2012, Adobe abandoned the perpetual license model — where a customer bought Photoshop CS6 for $700 once — and migrated entirely to a subscription model with Creative Cloud.
At the time, revenues dropped significantly in the short term. Shareholders complained. The stock price suffered. But management — led by Shantanu Narayen, CEO since 2007 — held the course.
The result, years later, is one of the most predictable and profitable business models in the technology sector: recurring revenues, high customer retention, and expanding margins. This transformation is the origin of Adobe’s moat. Total Adobe ARR exited FY2025 at $23B and Q1 FY2026 at $25B — the subscription engine continues to compound.
Market Analysis
Market Size and Growth
Adobe operates across three distinct market segments, each with its own competitive dynamics and growth trajectory. Understanding the size and direction of these markets is essential to evaluating the long-term opportunity.
Digital Media — Creative Software
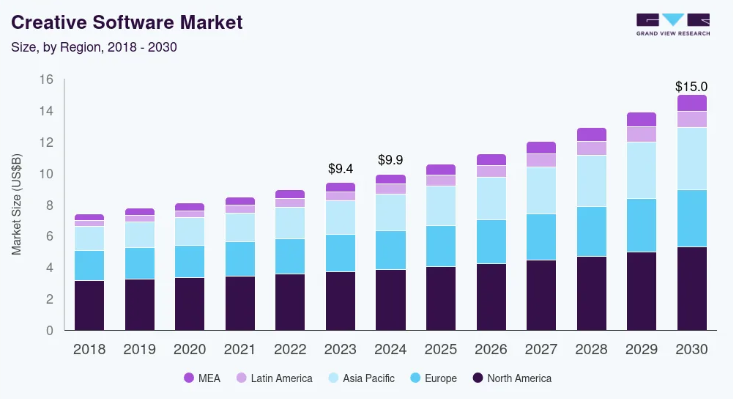
According to Grand View Research, the global creative software market was valued at $9.93 billion in 2023 and is projected to reach $14.98 billion by 2030, growing at a CAGR of 7.1%. North America leads with a 39.3% market share, and cloud-based deployment accounts for 64.1% of global revenue — a structural characteristic that plays directly to Adobe’s subscription model. The market is being reshaped by three forces simultaneously: the proliferation of AI-first generative tools, the expansion of the creator economy, and the increasing digitization of education and small business workflows.
Adobe holds an estimated 60-70% share of the professional creative software segment. This dominance is not static — it is actively being reinforced through Firefly’s integration into the core Creative Cloud workflow, Firefly Enterprise for brand-specific model training, and the expansion of Express into the broader prosumer market. The key risk in this segment is not Canva or Affinity — it is whether AI tools eventually commoditize tasks that today require professional software. Adobe’s response is to embed AI as a feature rather than allow it to become a substitute.
Digital Media — Document Management
The document management market sits within Adobe’s Digital Media segment and represents one of its most defensible positions. PDF is a de facto global standard with no credible challenger after four decades. Adobe Acrobat’s competitive advantage is not the PDF format itself — it is the workflow integration that surrounds it: editing, signing, sharing, AI summarization, and collaboration within a single application. Acrobat AI Assistant monthly active users doubled year over year in Q1 FY2026, demonstrating that AI is expanding usage within Document Cloud rather than cannibalizing it. Express, now embedded in 99% of US Fortune 500 companies, creates additional cross-sell surface area.
Digital Experience — Digital Experience Platforms
This is Adobe’s highest-growth and most contested segment. According to Mordor Intelligence (January 2026), the global Digital Experience Platform market reached $17.82 billion in 2026 and is projected to grow to $30.11 billion by 2031, at a CAGR of 11.06%. This figure is significantly larger than previously estimated — the market has grown faster than consensus projections. North America accounts for 38.73% of 2026 revenue, making it the largest single region and Adobe’s primary market. Cloud deployment captured 57.83% of 2025 revenue and is the fastest-growing modality at 13.11% CAGR, directly aligned with Adobe’s architecture.
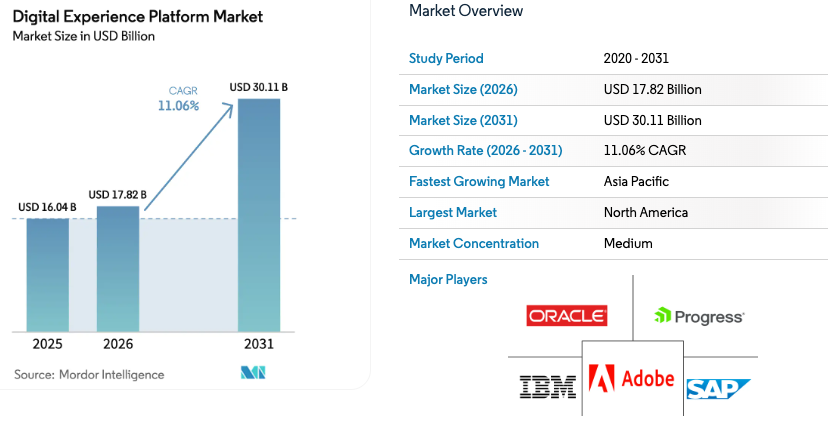
Adobe’s specific DXP advantages include the Agent Orchestrator — which enables autonomous AI agents to iterate creative assets and adjust campaign bids in real time — and Firefly’s ability to automate product content across 29 languages, a capability that standalone DXP competitors cannot replicate without a creative software foundation.
The broader Digital Marketing Software context
To understand where Adobe Experience Cloud fits within the larger ecosystem, Future Market Insights estimates the total global digital marketing software market — a broader category that includes DXPs, marketing automation, CRM-adjacent tools, and analytics platforms — will grow from $92.2 billion in 2025 to $305.9 billion by 2035, at a CAGR of 14.2%. Cloud-based deployment within this broader market is growing at 15.9% CAGR. Adobe Experience Cloud is one of the leading platforms cited in this market alongside Salesforce, HubSpot, Oracle, and SAP. The scale of this addressable market explains why Adobe’s $5.86B Digital Experience revenue, while already substantial, represents a single-digit percentage of what the market will ultimately be worth.

Print & Publishing
Adobe’s third reportable segment generated $256 million in FY2025 (-7% year over year) and represents approximately 1% of total revenue. It includes PostScript licensing and related legacy technologies from Adobe’s pre-subscription era. This segment is in structural decline and is not a consideration in the investment thesis beyond its immaterial cash contribution.
The Q1 FY2026 results provide concrete evidence that AI is working for Adobe, not against it: AI-first ARR more than tripled year over year, and 850 million monthly active users were recorded across all products (+17% YoY). Firefly generative credit consumption grew over 45% quarter over quarter. Adobe Firefly is the only major generative AI tool trained exclusively on licensed content, eliminating the copyright legal risks that threaten Midjourney, Stable Diffusion, and others.
One headwind: the traditional Adobe Stock business declined faster than expected in Q1 FY2026 as customers shift to generative AI for stock-type content. Management acknowledged this is playing out faster than planned. It is a real structural shift but is being offset by growth in Firefly credit packs and Firefly Enterprise.
Q1 FY2026 Update — Most Recent Financial Results
Adobe reported Q1 FY2026 results on March 12, 2026, the most current picture of the business at the time of writing:
| Metric | Q1 FY2026 | YoY Growth |
|---|---|---|
| Revenue | $6.40B | +12% |
| GAAP EPS | $4.60 | +11% |
| Non-GAAP EPS | $6.06 | +19% |
| Total ARR | $26.06B | +10.9% |
| AI-first ARR | >1/3 of total | >3x YoY |
| Monthly Active Users | 850M | +17% |
| Creative Freemium MAU | 80M | +50% |
| Q1 Operating Cash Flow (record) | $2.96B | +19% |
| Remaining Performance Obligations | $22.22B | +13% |
| Shares repurchased Q1 | 8.1M (~$2.5B) | — |
| Buyback authorization remaining | $3.89B | — |
Q1 operating cash flow of $2.96B was a record for any Q1 in Adobe’s history. The company repurchased 8.1 million shares (~$2.5B) in a single quarter and still has $3.89B remaining under the $25B buyback authorization. Revenue and EPS guidance for Q2 FY2026 indicates continued growth: revenue $6.43-6.48B and GAAP EPS $4.35-4.40.
The pending acquisition of Semrush Holdings (subject to regulatory approval) will add brand visibility capabilities critical for the agentic web era. Adobe Digital Insights data shows LLM-driven traffic to retail sites grew nearly 7x during the 2025 holiday season, converting 31% better and generating 254% more revenue per visit. Adobe LLM Optimizer directly addresses this opportunity.
Competition and Market Analysis
The 10-K FY2025 identifies five competitive categories: large global software companies, specialized smaller companies, new AI-native entrants, social media platforms with built-in editing, and hardware/OS developers. This is broader and more dynamic than the traditional competitive map.
Competitive Comparison — Key Metrics
| Company | Revenue TTM | Rev Growth | EBIT Margin | P/E | EV/EBITDA | FCF Margin |
|---|---|---|---|---|---|---|
| Adobe (ADBE) | $24.5B | +12% | 36.6% | 14.5x | 9.9x | ~41% |
| Salesforce (CRM) | $41.5B | +12.1% | 19.2% | 23.3x | 13.9x | ~28% |
| Oracle (ORCL) | $64.1B | +21.7% | 32.7% | 32.1x | 20.6x | ~25% |
| Microsoft (MSFT) | $305B | +16.7% | 47.1% | 26.3x | 16.4x | ~35% |
- Adobe has the lowest valuation of the group despite comparable or superior fundamentals. Trading at 14.5x P/E versus Salesforce at 23x, Oracle at 32x, and Microsoft at 26x — Adobe is the cheapest in the peer group and not cheap because of inferior quality. Its EBIT margin (36.6%) is the second highest, its FCF margin (~41%) the highest.
- The margin gap versus Salesforce is the most telling. Salesforce generates 70% more revenue than Adobe but with an EBIT margin of only 19.2% versus Adobe’s 36.6%. Adobe is simply a more efficient business.
- Oracle is growing faster (+21.7%) but is a fundamentally different business — infrastructure and cloud database — and benefits from Larry Ellison’s 40.5% insider ownership, providing alignment Adobe lacks.
- Microsoft is the most comprehensive competitor but creative software remains a secondary priority for a $3.1T company focused on Azure and AI infrastructure.
[ INSERT IMAGE: TIKR — Comparative NTM P/E chart Adobe vs CRM vs ORCL vs MSFT — 2020-2026 ]
Segment-by-Segment Competitive Breakdown
Digital Media — Creative Cloud vs. Canva and AI tools
Canva (~185M users, $2.3B revenue) serves a fundamentally different non-professional market. Switching costs for professional Adobe users within the Digital Media segment are real: years of learned workflows, custom presets, and deep application integration are not easily transferred. The AI threat is being addressed proactively — Firefly Enterprise new customer acquisition grew 50% YoY, and Firefly Foundry (private enterprise models trained on brand-owned content) is gaining traction with media companies. 85% of films premiering at the 2026 Sundance Film Festival were made using Adobe Creative Cloud tools.
Digital Media — Document Cloud vs. DocuSign, Dropbox Sign
Adobe Acrobat Sign competes with DocuSign (~40% e-signature market share, $2.9B revenue) and Dropbox Sign. Adobe’s structural advantage is integration — signing within the existing PDF workflow without application switching. The new Acrobat Studio integrates AI, collaboration, and creation in a single offering. Acrobat AI Assistant MAU doubled YoY in Q1 FY2026, demonstrating that AI is expanding usage within Document Cloud rather than cannibalizing it.
Digital Experience — Experience Cloud vs. Salesforce Marketing Cloud
The most competitive of Adobe’s three segments. Salesforce’s Marketing Cloud, combined with Data Cloud and Einstein AI, is the most direct competitor. Salesforce has a CRM integration advantage — its customer data sits natively within Salesforce. Adobe’s counter-advantage is the creative-to-delivery pipeline: the only company that connects professional content creation (Digital Media) with enterprise content delivery and analytics (Digital Experience) in a single ecosystem. In Q1 FY2026, AEP subscription revenue grew 30%+ YoY and over 650 customer trials are underway for LLM Optimizer, Sites Optimizer, and Brand Concierge.
Income Statement — 10 Years of History
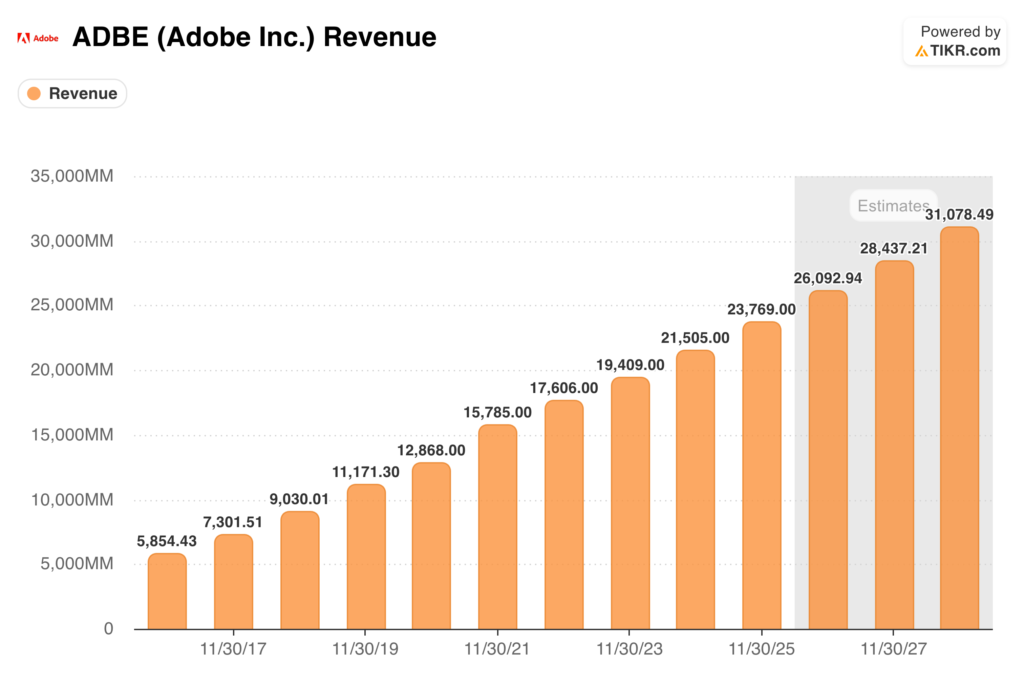
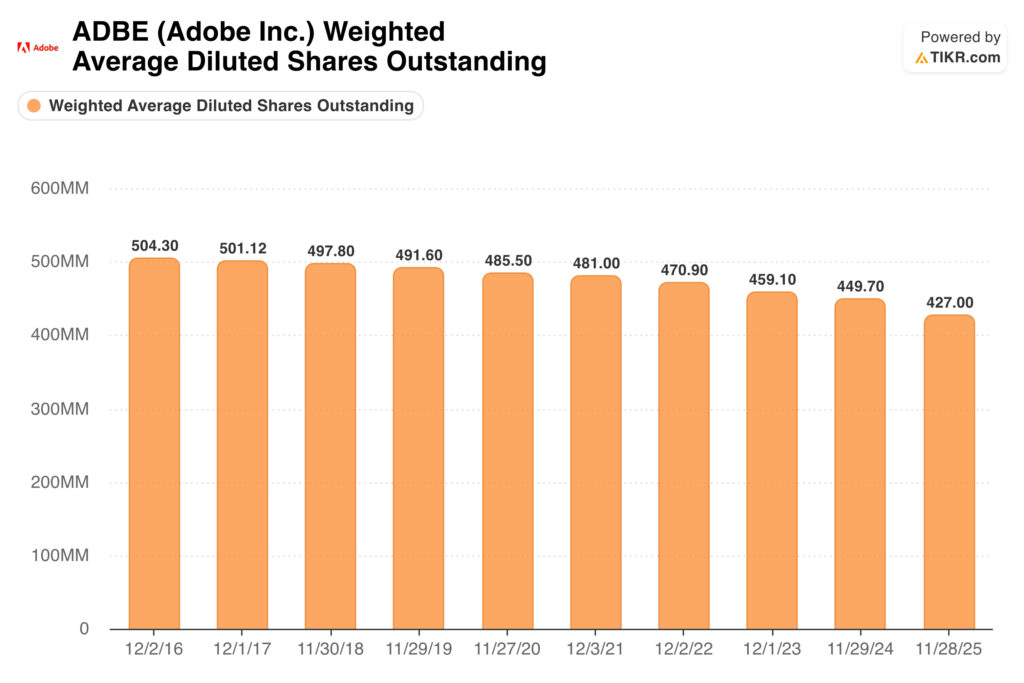
Adobe’s fiscal year ends in November. All figures below use GAAP Operating Income (from 10-K) as EBIT, and GAAP diluted EPS as reported. Revenue has grown from $4.1B in FY2013 to $23.8B in FY2025 — a CAGR of 15.8% over 12 years.
Important clarification: FY2025 GAAP EPS is $16.70. The widely cited $20.94 figure is Non-GAAP (excluding ~$1.9B stock-based compensation and amortization). The Value Investing Model uses GAAP throughout. Model inputs: Revenue Growth 11% – EBIT Margin 34% – Tax Rate 21%.
| Year | Revenue | EBIT (Op. Income) | EBIT Margin | Net Income | EPS (GAAP) |
|---|---|---|---|---|---|
| FY2020 | $12.87B | $5.52B | 42.9% | $4.76B* | $10.83 |
| FY2021 | $15.79B | $7.26B | 46.0% | $4.82B | $10.02 |
| FY2022 | $17.61B | $7.95B | 45.1% | $4.76B | $10.10 |
| FY2023 | $19.41B | $8.92B | 45.9% | $5.43B | $11.82 |
| FY2024 | $21.51B | $6.74B | 31.3%† | $5.56B | $12.36 |
| FY2025 | $23.77B | $8.71B | 36.6% | $7.13B | $16.70 |
| Q1 FY2026 | $6.40B | $2.42B | 37.8% | $1.89B | $4.60 |
*FY2020 Net Income includes $1.1B extraordinary tax benefit. †FY2024 EBIT impacted by $1B Figma termination charge. Q1 FY2026 is a single quarter, not annualized. Source: SEC EDGAR / Alpha Vantage / TIKR.
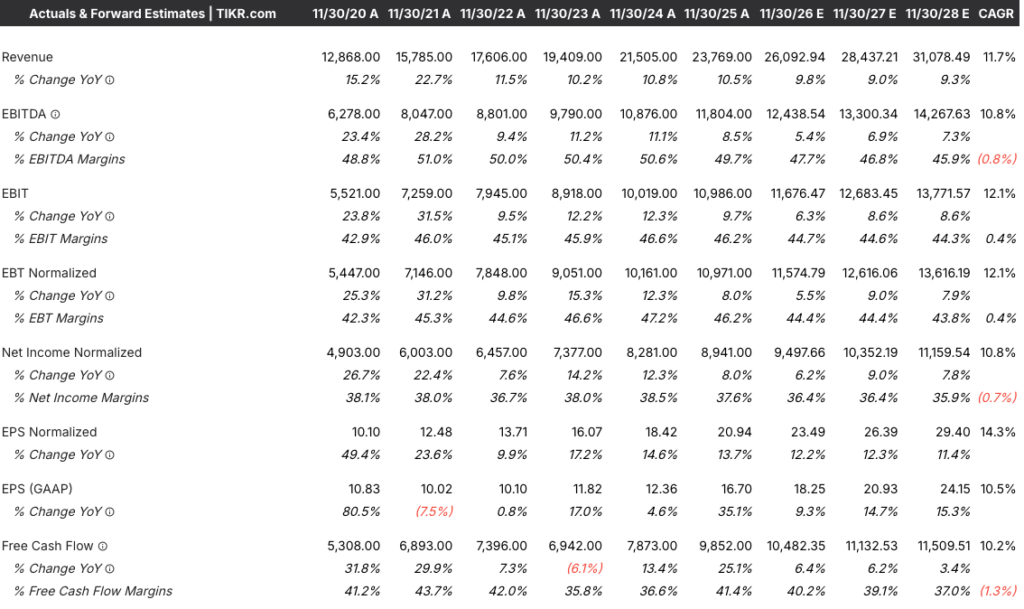
- Gross Margin consistently above 88%. For every $1 of revenue, Adobe retains more than $0.88 before operating expenses — one of the strongest indicators of genuine pricing power.
- EBIT Margin 42-46% in FY2020-FY2023, normalizing to 36-37% in FY2024-FY2025. The decline from the FY2020-FY2023 range reflects increased SBC costs and the Figma termination charge in FY2024. The model conservatively projects 34% EBIT margin going forward.
- GAAP EPS CAGR FY2020 to FY2025: 9.1% ($10.83 to $16.70). Non-GAAP EPS grew faster (~15.7%) due to SBC exclusion. GAAP is the honest lens for value investing.
[ INSERT IMAGE: TIKR — EPS Normalized ADBE 2015-2025 ]
[ INSERT IMAGE: Adobe — Operating Expenses breakdown FY2025 — Source: 10-K FY2025, SEC EDGAR ]
Balance Sheet and Cash Flow
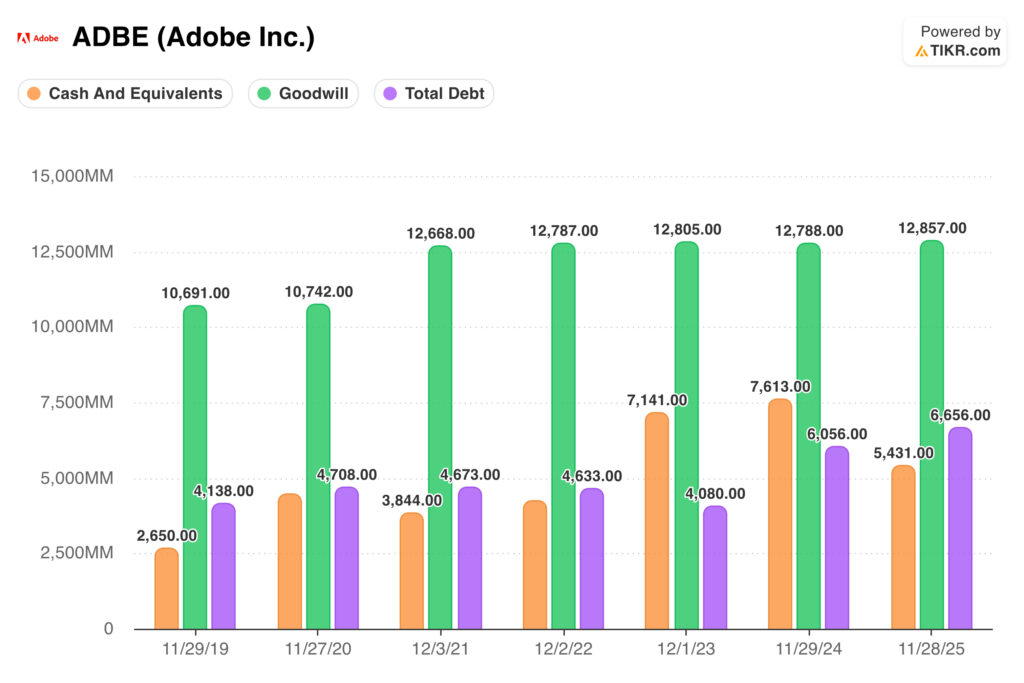
- Cash position: $5.4B at FY2025 end (November 2025), rising to $6.9B exiting Q1 FY2026 (February 2026). Adobe generates cash faster than it deploys it.
- Debt: $6.6B total (including $438M leases). Net debt practically neutral.
- Goodwill: $12.9B primarily from Marketo ($4.75B, 2018) and Magento ($1.68B, 2018). The blocked Figma deal avoided another ~$20B.
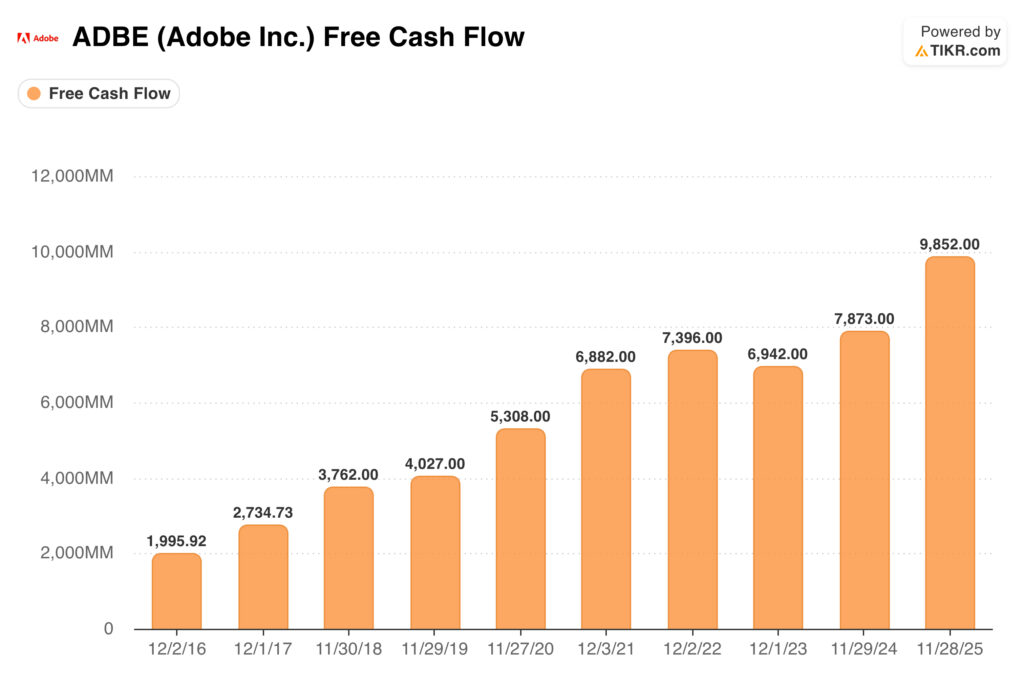
| Year | Operating CF ($B) | Capex ($B) | FCF ($B) | FCF Margin |
|---|---|---|---|---|
| FY2020 | 5.7 | 0.4 | 5.3 | 41.2% |
| FY2021 | 7.2 | 0.3 | 6.9 | 43.7% |
| FY2022 | 7.8 | 0.4 | 7.4 | 42.0% |
| FY2023 | 7.3 | 0.4 | 6.9 | 35.6% |
| FY2024 | 8.1 | 0.2 | 7.9 | 36.7% |
| FY2025 | 10.0 | 0.2 | 9.9 | 41.4% |
| Q1 FY2026 | 2.96 (Q1 record) | 0.04 | ~2.9 | 45%+ |
A FCF Margin consistently above 40% is exceptional. Q1 FY2026 operating cash flow of $2.96B annualizes to ~$11.8B — above FY2025’s full-year $10B. The FCF trajectory is accelerating, not decelerating.
Buybacks — a critical management signal: Adobe repurchased $11.3B in shares in FY2025 (30.8 million shares, >6% of outstanding) and another 8.1 million shares in Q1 FY2026 alone (~$2.5B). The $25B authorization (granted March 2024) has $3.89B remaining. Management is buying aggressively at multi-year price lows — the strongest possible signal that they consider the stock undervalued.
Capital Returns
| Metric | FY2020 | FY2021 | FY2022 | FY2023 | FY2024 | FY2025 |
|---|---|---|---|---|---|---|
| ROE | — | — | — | 39.4% | 61.3% | |
| ROCE s/ Goodwill | 19.0% | 24.9% | 26.6% | 24.9% | 25.5% | 37.8% |
| ROCE c/ Goodwill | 12.9% | 16.1% | 17.1% | 17.0% | 17.5% | 24.6% |
| Net Debt / EBITDA | 0.06x | 0.14x | 0.07x | -0.38x | -0.19x | 0.13x |
ROCE without goodwill (37.8% in FY2025) is the most meaningful capital return metric — it measures how efficiently Adobe generates operating returns from tangible capital employed, excluding acquisition premiums. The trend from 19% in FY2020 to 37.8% in FY2025 reflects genuine margin expansion and capital efficiency improvement.
Management and Ownership
IMPORTANT UPDATE: CEO Transition Announced March 12, 2026
On March 12, 2026 — the same day as Q1 FY2026 earnings — Shantanu Narayen announced his decision to transition from the CEO role after 18 years and 100 earnings calls. The Board has appointed Frank Calderoni (Lead Independent Director) to chair the special committee to identify a successor, considering both internal and external candidates. Narayen will remain as Chair of the Board to support the transition.
This is materially important for the investment thesis. Narayen has been the architect of Adobe’s two most transformative strategic decisions: the subscription pivot (2012-2015) and the Experience Cloud expansion (2018-present). Losing a founder-era CEO always carries execution risk. The announcement was made alongside strong Q1 results — a responsible and transparent approach — but until a successor is named and demonstrates competence, this represents elevated risk.
On the positive side, the 2026 Proxy Statement confirms several shareholder-friendly governance practices:
- No golden parachute excise tax gross-up payments
- No defined benefit pension plans or supplemental retirement plans for executives
- Clawback policies for all performance-based incentive compensation
- 10 of 11 board directors are independent (91%)
- Single class of stock — equal voting rights for all shareholders
- CEO compensation as % of revenue: ~0.16% ($39M / $23.8B revenue) — well below the 10% threshold that signals excessive extraction from the business
- Say-on-pay 2025: 80% approval — reasonable, not exceptional
One structural concern: Narayen serves simultaneously as Chair and CEO — a concentration of power that many institutional investors consider suboptimal. Post-transition, separation of Chair and CEO roles would be a governance improvement.
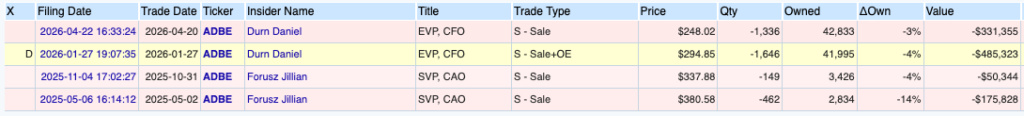
Insider ownership is very low at 0.25% of shares. This contrasts sharply with companies like Fortinet where the Xie family holds over 16%. Adobe lacks the founder-shareholder alignment that provides an additional margin of safety in governance decisions.
[ INSERT IMAGE: Adobe — Executive Compensation table — Source: Proxy Statement 2026, SEC EDGAR ]
Valuation
The valuation uses three independent methodologies: (1) DCF with Triple Anchor ROE, (2) price targets by multiple and scenario, and (3) Buffetology. All use GAAP EPS. Current price: $239.31.
1. Triple Anchor ROE — Growth Rate for the DCF
| Anchor | Value | Source |
|---|---|---|
| Anchor 1 — Actual ROE (FY2025) | 61.3% | Auto-calculated — Sheet 3 |
| Anchor 2 — EPS CAGR 10Y | 11.0% | Manual input — source TIKR |
| Anchor 3 — Max sustainable rate | 25.0% | Fixed — McKinsey / Damodaran |
| ROE Model = MIN(A1, A2, A3) | 11.0% | → g rate used in DCF |
The binding constraint is Anchor 2 — the 10-year historical EPS CAGR of 11%, sourced from TIKR. This is more conservative than Anchor 1 (actual ROE 61.3%, distorted by buybacks reducing equity denominator) and Anchor 3 (25% theoretical maximum). Using g=11% is disciplined and defensible.
2. DCF Analysis — Inputs and Results
| DCF Parameter | Value |
|---|---|
| EPS base (FY2025 GAAP) | $16.70 |
| Growth rate g (Triple Anchor ROE Model) | 11.0% |
| WACC base (CAPM, auto-calculated) | 12.54% |
| Checklist adjustment (score 48/55) | -1.00% |
| WACC final | 11.54% |
| Horizon | 10 years |
| Terminal multiple (P/E exit) | 20x |
The WACC of 11.54% is calculated via CAPM automatically and then adjusted -1% for the checklist score of 44/55. The P/E exit multiple of 20x is conservative relative to historical averages (30.9x) but appropriate given the elevated rate environment and CEO transition uncertainty.
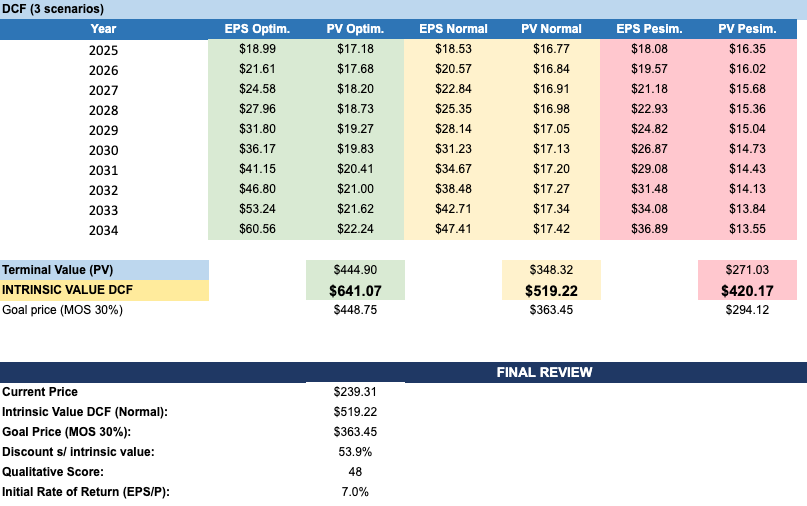
| Scenario | DCF Intrinsic Value | Price Target MOS 30% | vs. Current Price ($244) |
|---|---|---|---|
| Optimistic | $641.07 | $448.75 | +169% |
| Normal | $519.22 | $363.45 | +52% |
| Pessimistic | $420.17 | $294.12 | +23% |
DCF Veredict: BUY — Current price ($239.31) is 53.9% below the Normal intrinsic value ($519.22) and 19% below even the Pessimistic scenario price target with 30% MOS ($294.12). Score qualitativo: 48/55.
[ INSERT IMAGE: Your Excel model — Sheet 6, DCF & Dashboard ]
3. Valuation by Multiples — Three Scenarios
Multiples are anchored to real historical data from TIKR. Pessimistic uses current NTM multiples (the floor). Conservative uses recent 2022-2023 averages. Optimistic uses long-term historical means.
| Scenario | P/E | P/FCF | EV/EBITDA | EV/EBIT |
|---|---|---|---|---|
| Pessimistic | 10.2x | 9.6x | 7.8x | 8.3x |
| Conservative | 22.0x | 20.0x | 16.0x | 18.0x |
| Optimistic | 31.0x | 28.0x | 23.0x | 25.0x |
Projected prices and implied CAGRs for 2030E:
| Scenario | Price 2030E (PER) | CAGR 5Y (PER) | Price 2030E (P/FCF) | CAGR 5Y (P/FCF) |
|---|---|---|---|---|
| Optimistic | $702.26 | +23.5% | $698.89 | +23.4% |
| Conservative | $498.38 | +15.3% | $499.21 | +15.4% |
| Pessimistic | $212.94 | -2.7% | $220.90 | -2.0% |
Note on historical multiples: The historical means include 2020-2022 when software companies traded at extreme valuations driven by near-zero interest rates. A normalized multiple for Adobe in a 4-5% rate environment is likely 20-25x P/E — the conservative scenario assumption of 22x is appropriate and defensible. Full historical mean recovery (31x) requires a successful CEO transition and sustained AI monetization.
[ INSERT IMAGE: TIKR — NTM P/E Adobe history 2016-2026, showing collapse from 50x to 14x ]
[ INSERT IMAGE: TIKR — NTM EV/EBITDA Adobe history 2016-2026 ]
[ INSERT IMAGE: Your Excel model — Sheet 4, Valuation by multiples ]
4. Buffetology Analysis — Initial Rate of Return
Using GAAP EPS $16.70 (FY2025) at price $239.31:
Initial Rate of Return (GAAP) = $16.70 / $239.31 = 7.0%
| Buffetology Metric | Value |
|---|---|
| Current price | $239.31 |
| EPS FY2025 (GAAP) | $16.70 |
| Initial Rate of Return (EPS/P) | 7.0% |
| 10Y Treasury Bond yield | 4.30% |
| Diagnosis vs bond | Stock more attractive than bond |
| Bond-equivalent price (EPS/Yield) | $388 |
| EPS 5 years ago (FY2020 GAAP) | $10.83 |
| EPS CAGR 5Y (FY2020→FY2025) | 9.1% |
| EPS 10 years ago (FY2015, Anchor 2) | ~$3.02 |
| EPS CAGR 10Y | 18.6% |
| CAGR used in projection | 10.0% |
| Historical mean P/E (input) | 30x |
The IRR of 7.0% is above the Treasury Bond yield (4.30%), with a spread of ~2.7 percentage points. For a 10% required return: entry price ~$167. For 8%: ~$209. Current price of $239.31 implies a GAAP IRR of 7.0%.
Projected Prices — Historical P/E x Projected EPS (CAGR 10%, P/E 30x)
| Horizon | Projected EPS | Projected Price | Annual CAGR |
|---|---|---|---|
| 2030 (5 years) | $26.89 | $806.76 | 26.97% |
| 2035 (10 years) | $43.31 | $1,299.30 | 18.18% |
| Scenario | P/E | Price 2030 | Price 2035 | 10Y CAGR |
|---|---|---|---|---|
| Pessimistic | 9.4x | $252.79 | $407.11 | 5.2% |
| Normal | 22.0x | $591.63 | $952.82 | 14.6% |
| Optimistic | 31.0x | $833.66 | $1,342.61 | 18.6% |
The Normal Buffetology scenario (P/E 22x) implies a 14.6% CAGR over 10 years. The pessimistic scenario (P/E 9.4x, current depressed multiples) shows a 5.2% CAGR, still above the bond yield. The distribution of outcomes is skewed positively.
[ INSERT IMAGE: Your Excel model — Sheet 7, Buffetology Price Projections ]
Key Risks
- 1. CEO succession (elevated, time-sensitive) — The March 2026 announcement is the most significant near-term risk. Until a successor is named and demonstrates strategic continuity, the market may maintain or increase its discount. The search process will likely take 6-12 months.
- 2. Adobe Stock structural decline — Traditional stock content licensing is declining faster than expected. The offset (Firefly credit packs, Firefly Enterprise) is growing but remains smaller than the legacy business.
- 3. Generative AI disruption — Firefly’s commercially safe positioning is a meaningful advantage, but the landscape evolves rapidly. If AI fundamentally democratizes professional-quality content creation, the Creative Cloud TAM contracts.
- 4. Multiple compression persistence — The P/E has been compressed for over 2 years without a re-rating catalyst. An investor buying today must be comfortable holding through potential continued compression even if business fundamentals remain strong.
- 5. Regulatory risk — The Figma precedent set a template for large acquisitions. The pending Semrush deal requires regulatory approval. Inorganic growth is increasingly restricted.
- 6. Stock-based compensation dilution — ~$1.9B in SBC in FY2025 (8% of revenue) creates a persistent gap between GAAP and Non-GAAP earnings. The buyback program offsets share count dilution, but the economic cost is real.
Catalysts
- Successful CEO transition — A well-received successor announcement could be the single biggest catalyst for multiple re-rating. The transition period itself may create a buying opportunity.
- AI monetization acceleration — AI-first ARR tripled YoY in Q1 FY2026. Firefly subscription and credit pack ARR grew 75% quarter over quarter. Continued momentum directly addresses the market’s key concern.
- Semrush acquisition close — Adds brand visibility for the agentic web. LLM-driven retail traffic grew 7x in the 2025 holiday season per Adobe Digital Insights. Adobe LLM Optimizer plus Semrush creates a unique offering.
- Experience Cloud sustained 30%+ growth — If AEP and GenStudio maintain 30%+ growth through FY2026, it changes the market narrative from ‘one-product company at risk’ to ‘two high-growth engines.’
- Continued buybacks at current prices — With $3.89B remaining and ~411M shares outstanding, Adobe could retire another ~16M shares at $244, adding ~$0.65 to EPS annually from buyback alone.
Final Comments
The model gives a clear verdict: BUY, as the stock is trading significantly below intrinsic value. The current price of $239.31 is 53.9% below the Normal DCF intrinsic value ($519.22) and below even the Pessimistic scenario MOS 30% target ($294.12).
The business quality is exceptional: 8/8 screening filters passed, checklist score 44/55, FCF margin above 40% for 6 consecutive years (verified GAAP figures from SEC EDGAR), ROCE without goodwill of 37.8%, and management executing the most aggressive buyback program in the company’s history at multi-year price lows.
The market’s fear is legitimate but appears overdone. The generative AI disruption narrative drove a 53-67% discount to historical multiples not justified by the actual Q1 FY2026 results: AI-first ARR tripled, creative freemium MAU grew 50%, and operating cash flow reached a Q1 record.
The CEO transition is the most significant risk. It introduces a period of uncertainty that could delay the multiple re-rating even if the business continues to perform. Patience is required.
ENTRY PRICE: At $239.31, the GAAP IRR is 7.0% — above the bond but below what a demanding value investor requires given the elevated risks from the CEO transition. The DCF model shows a 53.9% discount to normal intrinsic value ($519.22) and a BUY verdict. A price between $180-200 would provide a GAAP IRR of 8.4-9.3% and a more adequate margin of safety. The CEO transition period itself may create that opportunity if the market reacts negatively before the succession is resolved.
This analysis is personal and does not constitute financial advice. Always conduct your own due diligence before making investment decisions.