BRKR or Bruker Corporation is a leading manufacturer of scientific instruments that are used by customers in life sciences, pharmaceuticals, applied markets, and academia. The company also provides diagnostic tools for microbiology and pathology labs.
Introduction
Bruker Corporation’s offerings can be categorized into the following segments:
- Bruker BioSpin Group: This segment offers products like nuclear magnetic resonance (NMR) spectrometers, magnetic resonance imaging (MRI) systems, and preclinical MRI research tools. They also provide solutions for EPR (electron paramagnetic resonance) applications.
- Bruker CALID Group: The CALID group offers a wide range of products including mass spectrometry tools, microbiology and diagnostic tools, infrared spectroscopy systems, and gas chromatography systems.
- Bruker Nano Group: This segment offers advanced materials research tools, nanoanalysis solutions, and microscopy, all of which are used in the semiconductor and other industrial markets.
- After-Sales Service: Apart from the primary products, Bruker also offers after-sales services including training, preventive maintenance, and other support services.
Their main lines of business include the design, manufacture, and distribution of high-performance scientific instruments and analytical and diagnostic solutions. Bruker operates in two segments: Bruker Scientific Instruments (BSI) and Bruker Energy & Supercon Technologies (BEST).
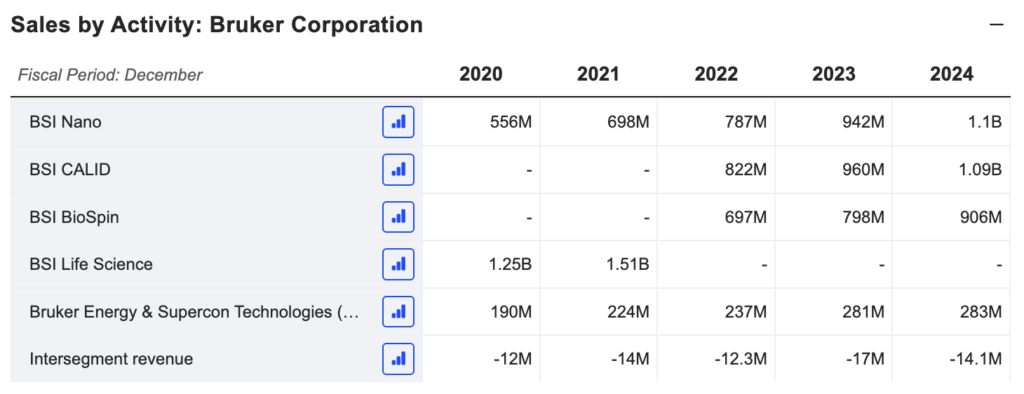
BSI encompasses the Bruker BioSpin Group, the Bruker CALID Group (which includes the Bruker Chemical & Applied Markets division, the Bruker Detection division, and the Bruker Daltonics division), and the Bruker Nano Group. These groups focus on advanced analytical solutions for the life sciences and physical sciences research, pharmaceuticals, biotechnology, and industrial markets.
The BEST segment designs, manufactures, and distributes superconducting materials, primarily metallic low temperature superconductors, for use in magnetic resonance imaging, nuclear magnetic resonance, fusion energy research, and other applications.
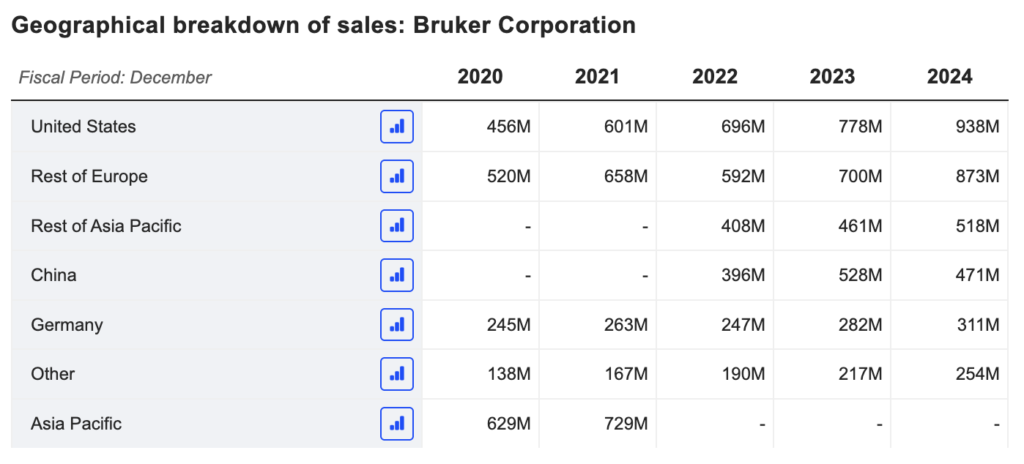
Bruker Corporation operates globally, with customers in over 60 countries. They have major operations in Europe and North America, with presence in Asia, Australia, and the Middle East. They have numerous sales and service offices around the world, including in the United States, Germany, United Kingdom, France, Japan, China, South Korea, India, and Australia. Their corporate headquarters is located in Billerica, Massachusetts, USA.
How does the company make money?
Bruker Corporation generates revenue through the following streams:
- Sale of Scientific Instruments: Bruker designs, manufactures, and distributes a broad range of proprietary life science and materials research systems and associated products. Their instruments are sold to customers in the pharmaceutical, biotechnology, and molecular diagnostic industries as well as to academic research institutions.
- Aftermarket Sales and Services: After the initial sale of an instrument, Bruker continues to generate revenue through the sale of consumables, accessories, software, and services related to their products. This includes maintenance contracts, repair services, training, and consulting.
- Collaborations and Partnerships: The company also enters into strategic partnerships and collaborations with other companies and research institutions. These collaborations may generate revenue through licensing fees, milestone payments, and royalties.
Market Research and Forecast
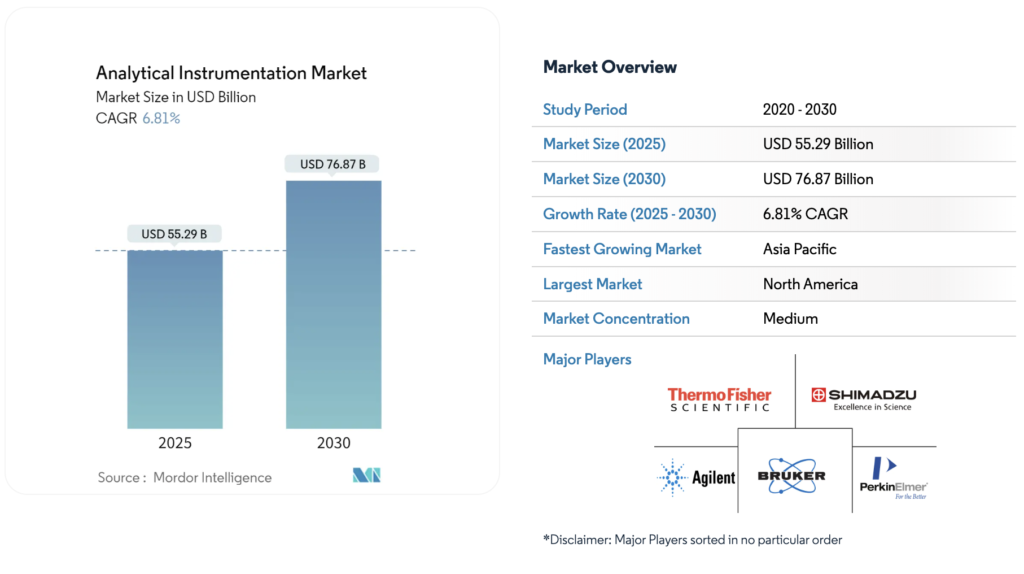
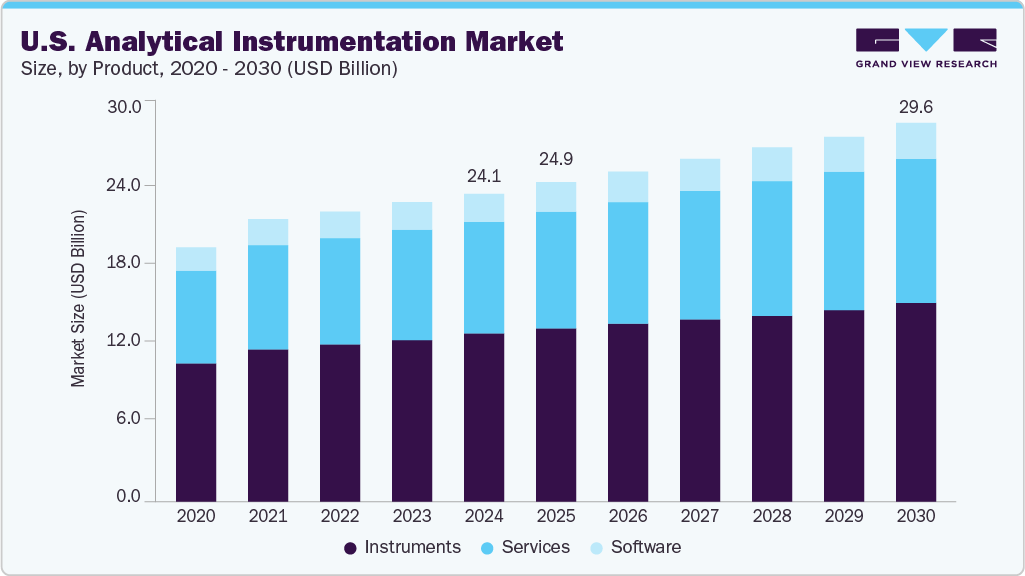
The global Analytical Instrumentation market is projected to grow to USD 76.87 Billion, and only in the US, it has been been growing since 2020, especially in North America, Europe, and Asia Pacific.
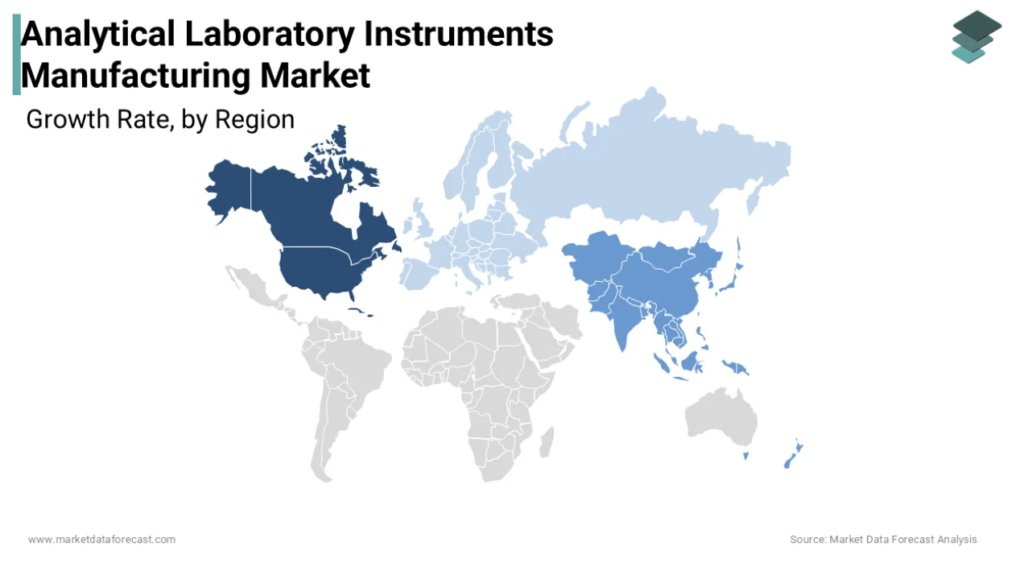
Regionally, North America commands the largest share—between 35% and 47% of global revenue in 2024. The U.S. market alone generated around USD 23.4 billion in 2024 and is expected to grow at a 5.5% CAGR to USD 37.7 billion by 2033. Meanwhile, Asia-Pacific, with a 2024 base of approximately USD 11.2 billion, is the fastest-growing region, with forecasts projecting a 7.2% CAGR through 2033 (reaching USD 20.6 billion)
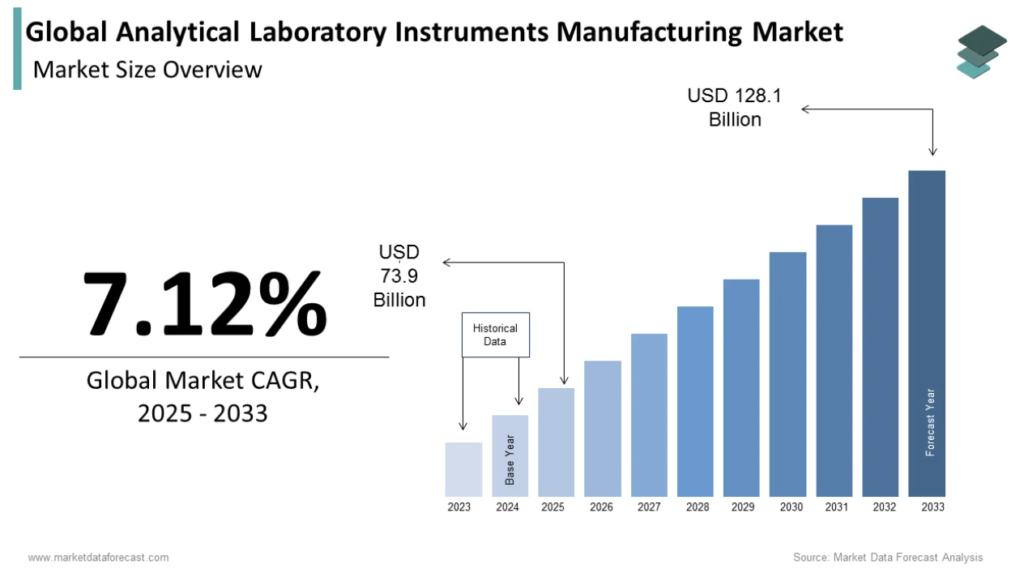
Several market reports estimate a CAGR for the global scientific instrument market ranging from 4.7% to 11.5% until 2030, depending on the specific segment (e.g., process spectroscopy).
Bruker Corporation (BRKR) Outlook
Bruker is well-positioned to benefit from this sector growth, although it faces its own challenges:
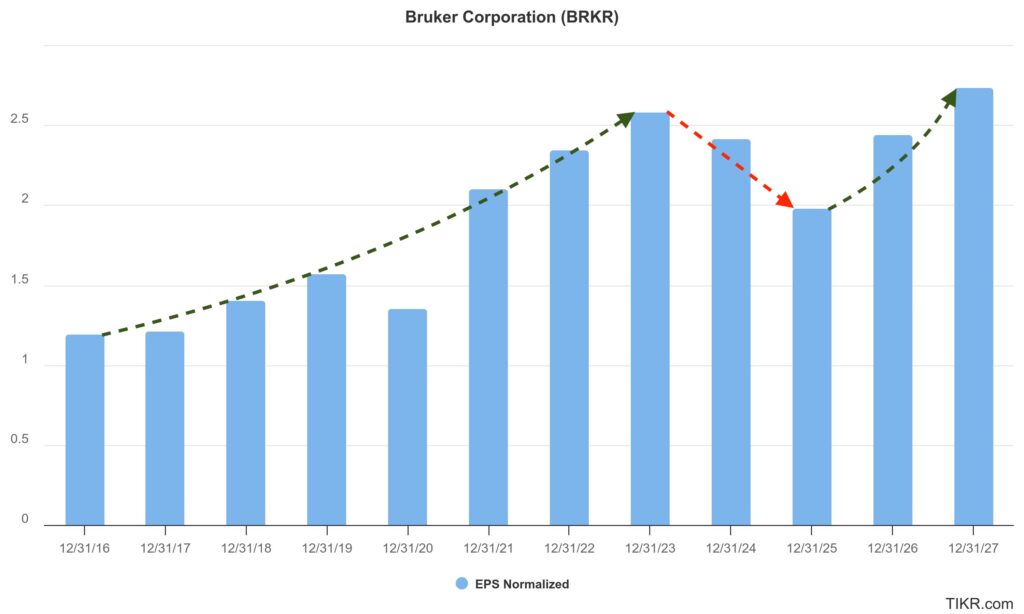
- Growth Projections: Analysts anticipate that Bruker Corporation will have annual revenue growth exceeding 3% and double-digit EPS growth in the coming years.
- Market Position: The company benefits from its diversified product portfolio and strategic acquisitions, which allow it to capitalize on opportunities in high-growth markets such as proteomics and spatial biology.
- Risks: Despite the positive outlook, the company faces risks such as the volatility of its profit margins, dependence on R&D investment (which can be fluctuating), and strong market competition.
Bruker’s Growth vs. its Rivals
Revenue Performance: Bruker has achieved consistent revenue growth. In fiscal year 2024, it reported an organic revenue growth of 4.0%, and for the first quarter of 2025, the organic growth of its scientific instruments segment (BSI) was 5.1%.
Market Share Performance
Despite intense competition, Bruker has proven capable of gaining market share in key areas such as mass spectrometry, molecular diagnostics, and spatial biology, often through strategic acquisitions. Bruker Corporation has currently a 8% in the Laboratory Analytical Instruments.
Stock Shares Decreases during H1 by >50%
Who hasn’t had a rough day? Well, in this case, it’s more like a rocky start to the year. But let’s see just how ‘bad’ it really has been, maybe it’s not so terrible after all!
In Q1 2025, Bruker reported revenues of $801.4 million, up 11% year-over-year, driven by strong demand in biomedical research and protein analysis. GAAP EPS was $0.11, down 68.6%, but non-GAAP EPS reached $0.47, exceeding expectations. The non-GAAP operating margin was 12.7%, and operating cash flow stood at $57.1 million, reflecting solid operational efficiency. The company maintained a net cash position of $1.93 billion and continued investing in post-genomic biology and drug discovery, supporting long-term growth.
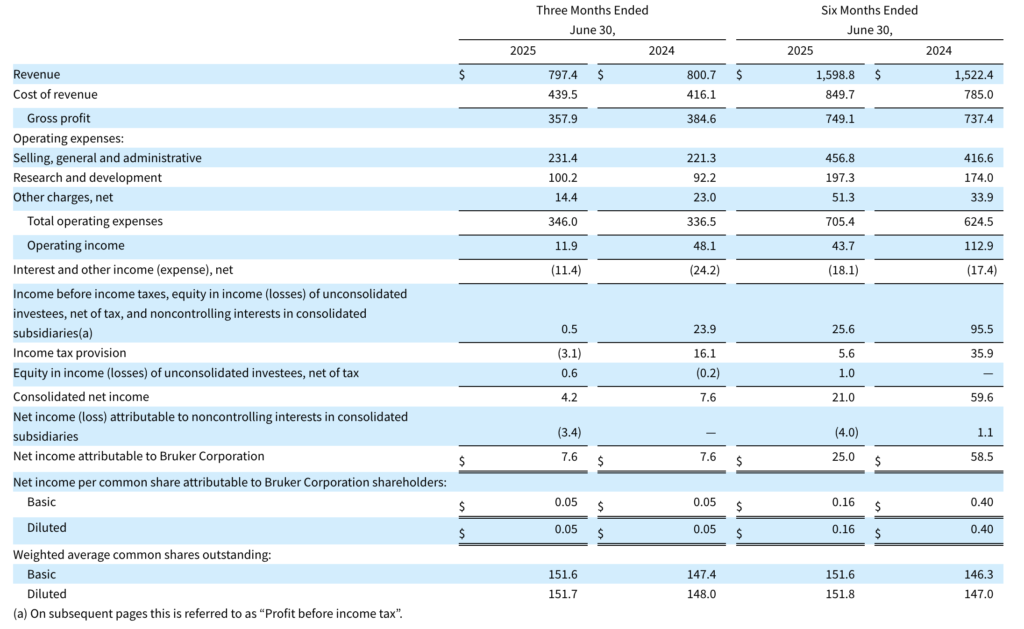
In Q2 2025, revenues slightly declined to $797.4 million, down 0.4% year-over-year, with organic revenue falling 7% and constant-currency revenue down 3.3%. GAAP EPS dropped to $0.05, while non-GAAP EPS fell to $0.32, reflecting weaker demand in the academic and U.S. biopharma markets.
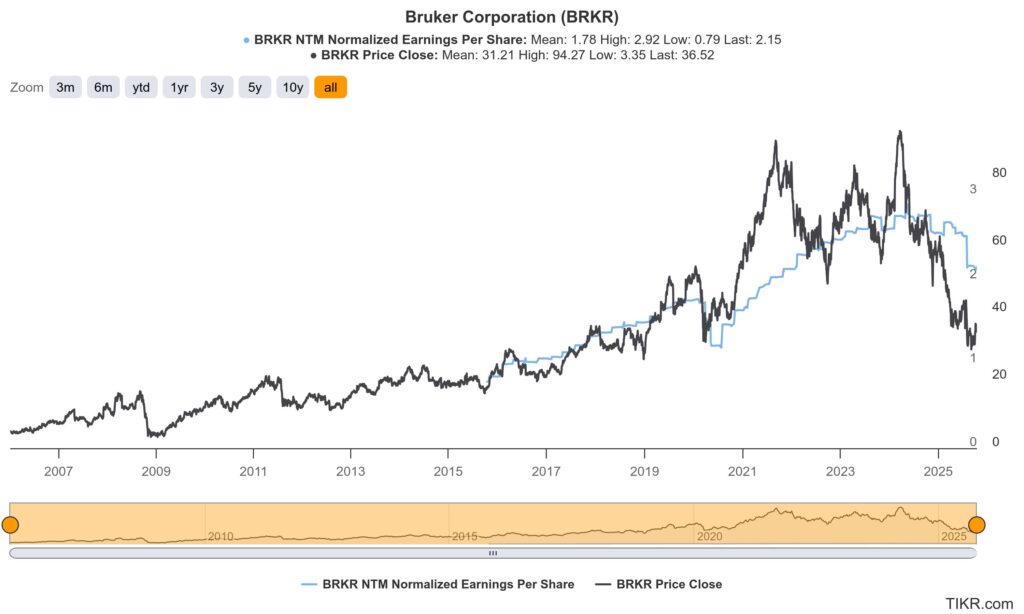
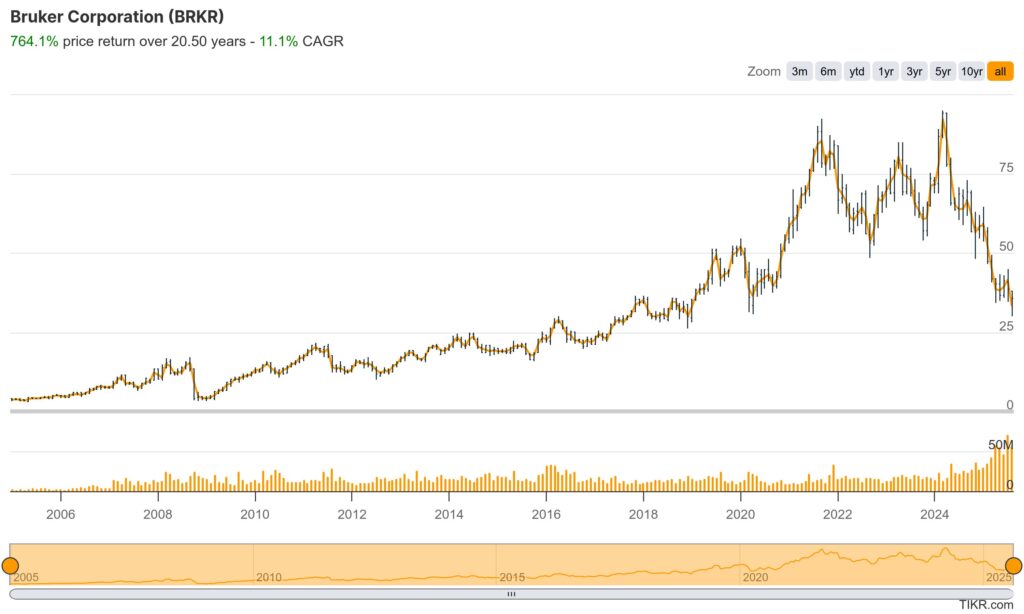
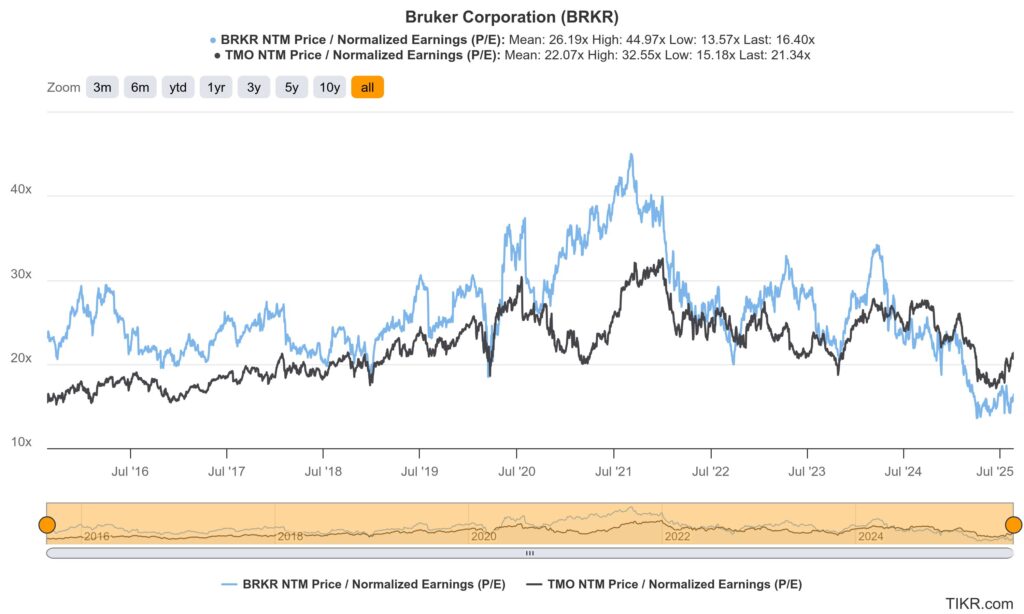
From a value perspective, the long-term price action for Bruker Corporation (BRKR) has exhibited a significant concern, particularly in the period from 2020 to 2024. During this time, the BRKR Price Close dramatically outpaced its fundamentals, showing an extreme divergence from the NTM Normalized EPS trend. This suggests the stock was trading at highly inflated multiples, disconnected from its underlying earnings power and relying heavily on speculative growth assumptions. As of late 2024 and 2025, the market has executed a sharp correction, significantly eroding the share price and closing the historical valuation gap. While this deleveraging of the multiple brings the price closer to a rational level—validating the view that the stock was previously overvalued—investors must now assess whether the current valuation offers a genuine margin of safety or if further earnings deceleration has been priced in.
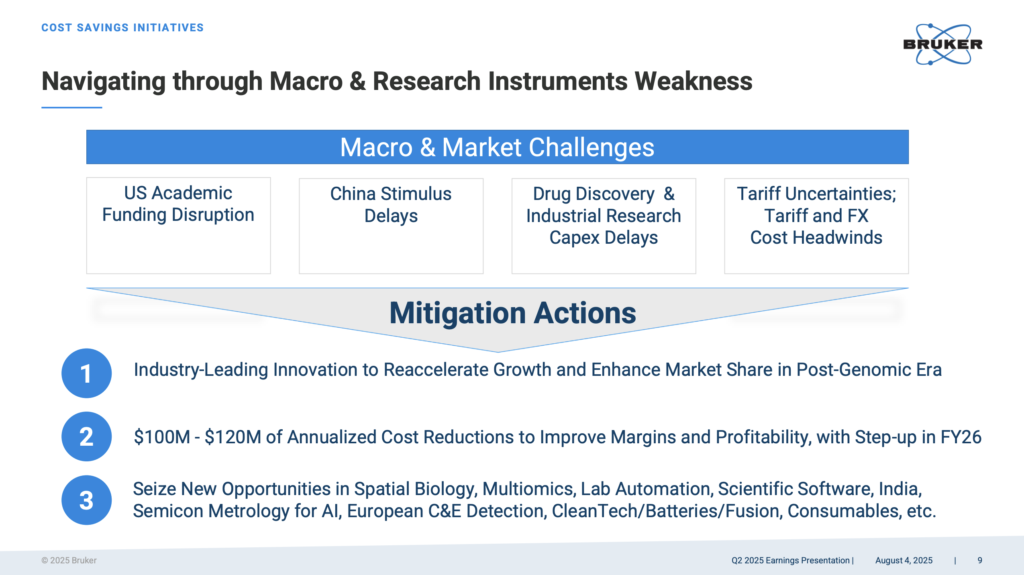
CEO Frank Laukien during the earnings call, described the quarter as “challenging,” attributing the underperformance to reduced demand in the U.S. academic sector, as well as in biopharma and industrial markets. Additionally, global tariffs and currency headwinds further impacted the company’s performance. To address this, Bruker launched cost-saving initiatives targeting $100–$120 million in annual reductions by 2026, as well Despite near-term challenges, continued investment in innovation positions the company for sustainable growth.
Leadership Team Analysis
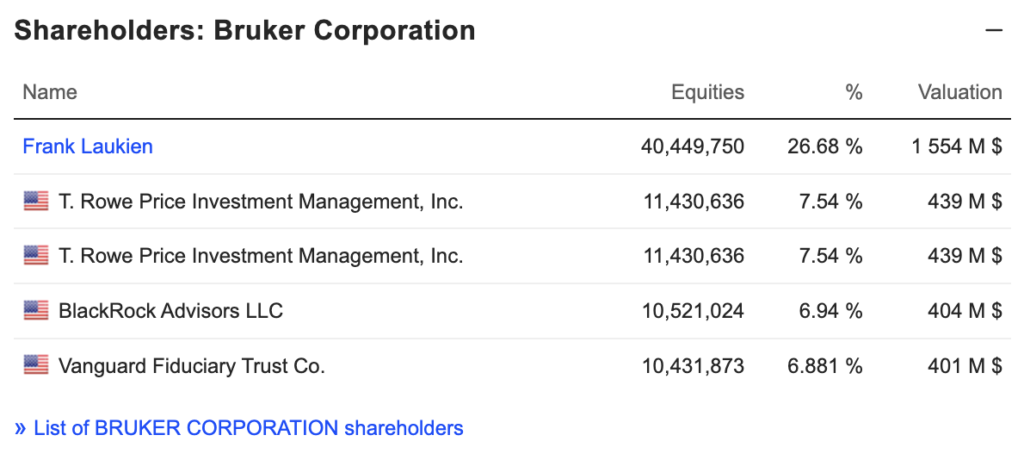
The company was founded in 1960 by Gunther Laukien in Karlsruhe, Germany, and initially, it was a family-owned business. However, it went public in 2000. Burker’s CEO Frank Laukien, holds more than 40M shares (26.68% of shares outstanding held), which is a good sign not only because he has a key role in the company but also because the Laukien family keeps a big share of the company, and convey a solid alignment between their and the company’s interests.
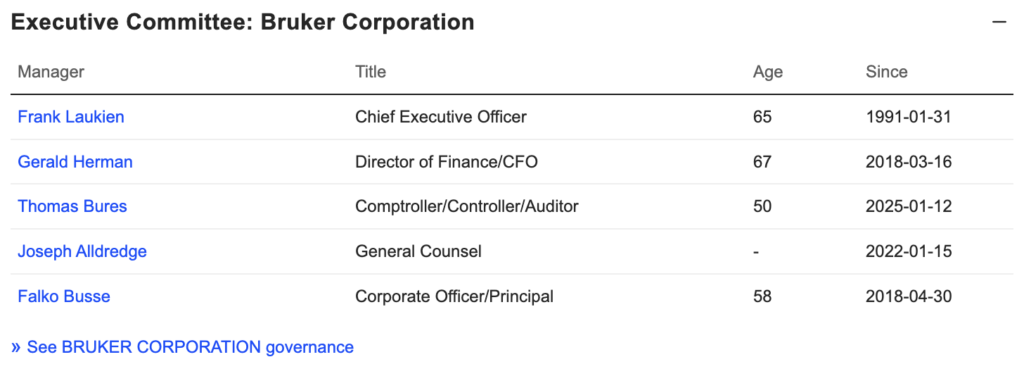
Below, I’ve included a snapshot of Bruker’s Key Executives, along with their yearly compensation. None of the stakeholders makes more than 10% in revenue, which is a positive sign and it makes me feel that the leadership team is not squeezing the organization funds.
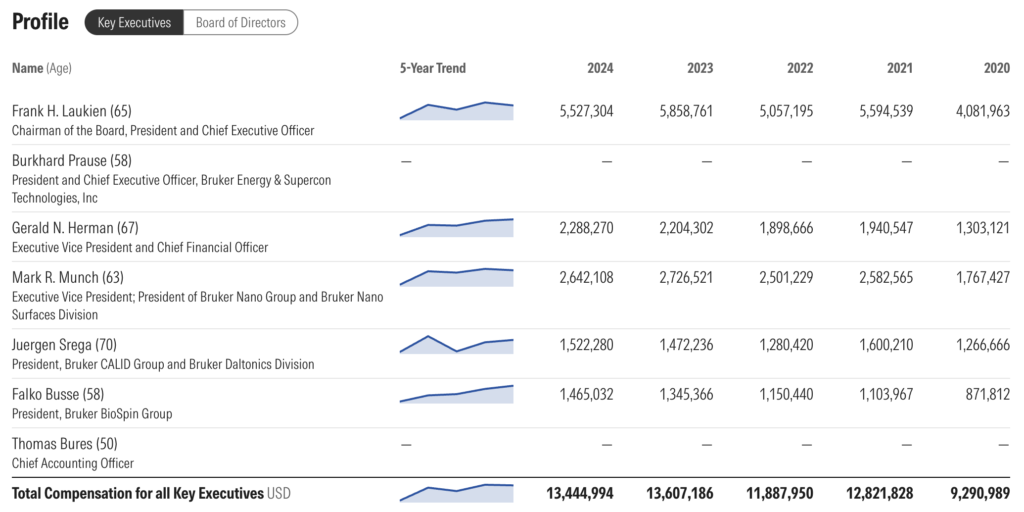
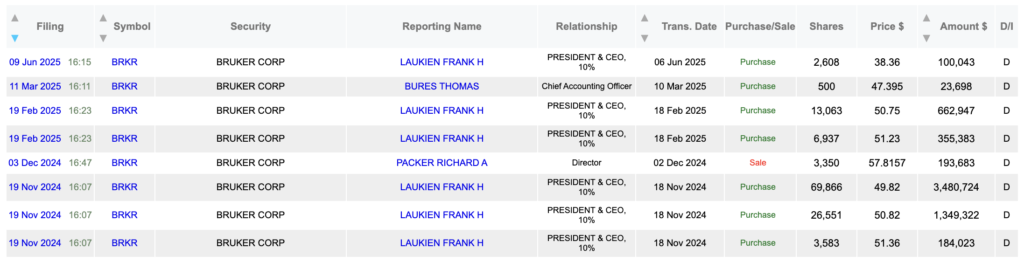
Regarding the Insiders, we have not identified unexpected movements or aggressive sales from the Executive team or board of Directors. In fact, the CEO has being buying since Q1 2025.
4.- Competitive advantages
As one of the top five players (alongside Agilent, Thermo Fisher, Shimadzu, Danaher), it captures a significant share of the consolidated analytical instrumentation market (approx. 65% combined share among these players, according to Mordon Inteligence).
The company’s strength lies in its expertise in mass spectrometry, material research, molecular analysis, and spectroscopy—areas aligned with the fastest-growing product categories. Innovations like timsTOF Ultra, Orbitrap, and high-resolution MS platforms place Bruker at the forefront when it comes to sensitivity, throughput, and advanced analytics, meeting laboratory needs in proteomics, complex mixtures, pharmacological pipelines, and emerging sectors like battery materials.
Customers rely heavily on vendor service support, often through tiered maintenance contracts—an area where Bruker has robust capabilities.
Regionally, Bruker is well-positioned to capitalize on growth in North America (largest market) and Asia-Pacific (fastest CAGR). Its global footprint and integration of automation, remote analytics, and AI-enable tools further differentiate it—especially as labs modernize workflows and seek predictive maintenance, cloud connectivity, and higher throughput.

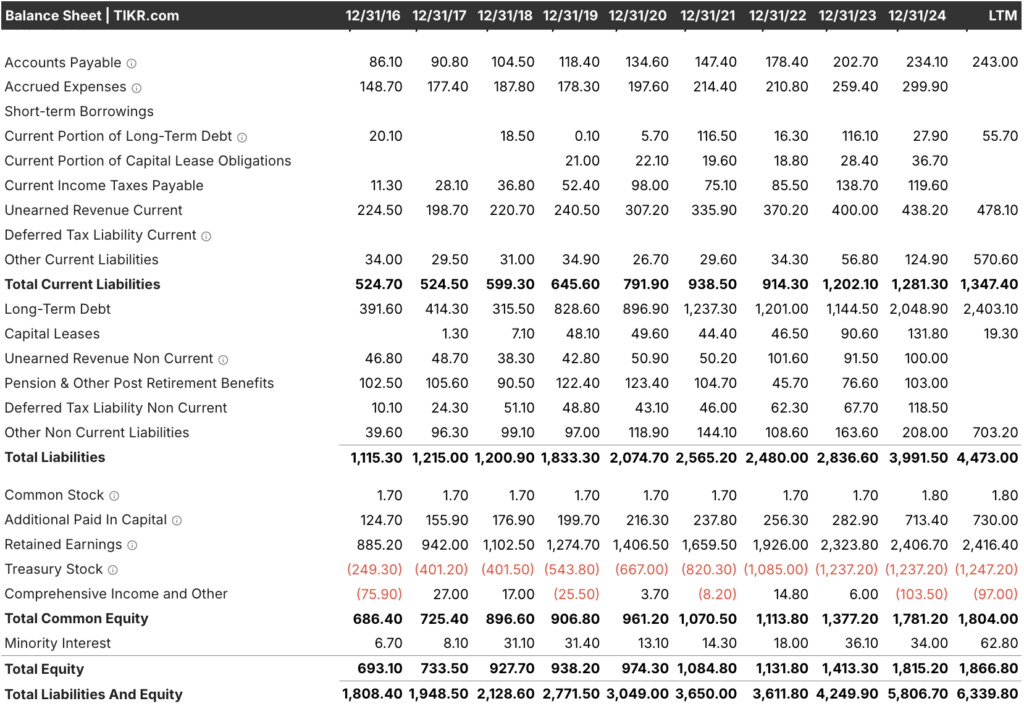
The company has good short-term liquidity ratios, especially the Current Ratio (total current assets / total current liabilities) which has been above 1 since 2013 and explains its power to pay down the current liabilities. It’s important to mention that the Current Ratio has decreased over the last three years, which is a metric that should be monitored to ensure the company keeps strong.
Switching Cost
Bruker’s customers face significant switching costs due to the high capital investment and specialized nature of its instruments. For instance, the average price of a Bruker mass spectrometer is approximately $500,000, with installation and training adding an additional 20% to the total cost. This substantial investment creates a high barrier to switching, as laboratories would incur significant costs to replace or retrofit equipment from another vendor.
Additionally, Bruker’s instruments are often integrated into complex workflows that include proprietary software and consumables. This integration further increases the switching cost, as transitioning to a new system would require not only replacing the hardware but also retraining staff and adapting existing processes. Such comprehensive changes are time-consuming and costly, reinforcing customer loyalty and reducing turnover.
Training Cost
Operating Bruker’s advanced instruments requires specialized knowledge, leading to substantial training costs. Training programs are typically conducted by Bruker-certified instructors and can last several weeks, depending on the complexity of the equipment. For example, training for a high-end NMR system can cost upwards of $10,000 per participant Wikipedia. These costs are often borne by the customer, adding to the overall expense of adopting Bruker’s technology.
Moreover, Bruker frequently updates its software and hardware, necessitating ongoing training to ensure users remain proficient. This continuous need for education creates a long-term commitment for customers, as they must allocate resources for periodic training sessions to keep pace with technological advancements.
Financials
Income Statement detailed review
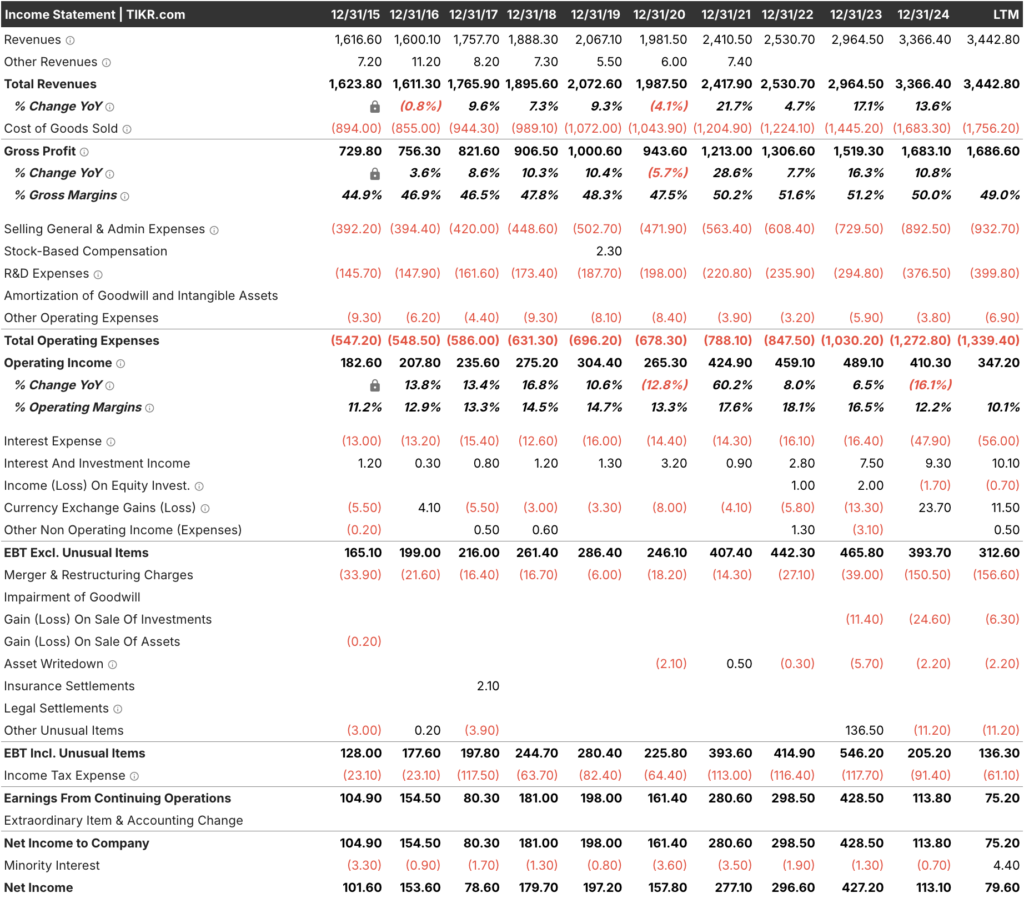
Bruker has demonstrated strong results over the last 10 years by keeping high and consistently growing Revenue, but also, sustainable Gross Margins which have been greater than 44% since 2015, which is a really positive indicator of a healthy business.
The increase on “Merger and Restructuring Charges” reduced significantly the Net Income on 2024, the reason behind this decrease is related to
In 2020, while the operating expenses did not raised, the Operating Income decreased by (12.8%) as a result of World Wide Health crisis. On the other hand, the Operating Margins have been double-digit over the last 10 years.
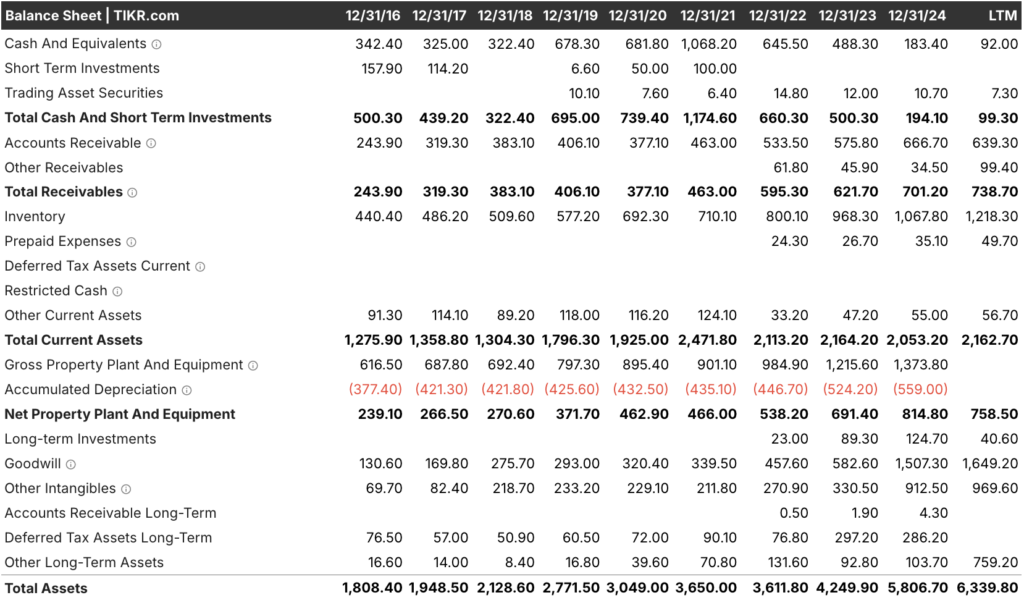
Balance Sheet
Burker has a positive liquidity ratio, if we take a look at its current assets vs. current liabilities, over the last 10 years the company has been above 1.2, which I consider a good ratio, and it tells us its capacity to generate liquidity in a short-term period. On the other hand, their Inventory and Net Income growing trend demonstrates a healthy and correlated selling cycle, where the volumes are still reasonable.
Valuation
Burker is currently valuated at 27% EV/EBITDA.
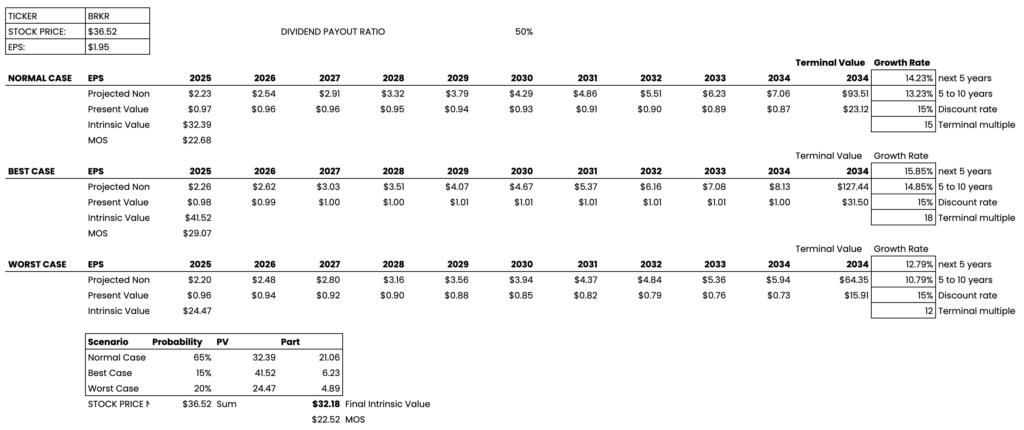
Instrinsic Value
Based on a simplified Discounted Cash Flow (DCF) model, Bruker Corporation (BRKR) appears to be significantly undervalued. With a current stock price of around $30, our analysis, using a 15% discount rate and our three different scenarios, estimates the intrinsic value to be approximately $32.18 per share, approximately.
The analysis indicates that BRKR is overvalued at its current price of $37.24, given that the calculated intrinsic value is approximately $27.35. This suggests that the market is valuing the company beyond its ability to generate future earnings. The multiples and ratios (P/E, P/B, ROE) should be compared with industry averages to assess whether they are in line with the company’s maturity. In this case, the margin of safety is insufficient, indicating significant risk for investors.
Based on the analysis performed, I consider BRKR to be overvalued. Despite a history of growth and a healthy ROE, the current share price does not adequately reflect its intrinsic value. Growth projections, while optimistic, present a considerable risk of not being met. Therefore, I would recommend that investors be cautious and consider waiting for a more attractive price before making a purchase.
Overall Summary
BRKR shows solid fundamentals, but the current price does not justify its intrinsic value. The company could be an option to consider in the future if the price adjusts to a more reasonable level.