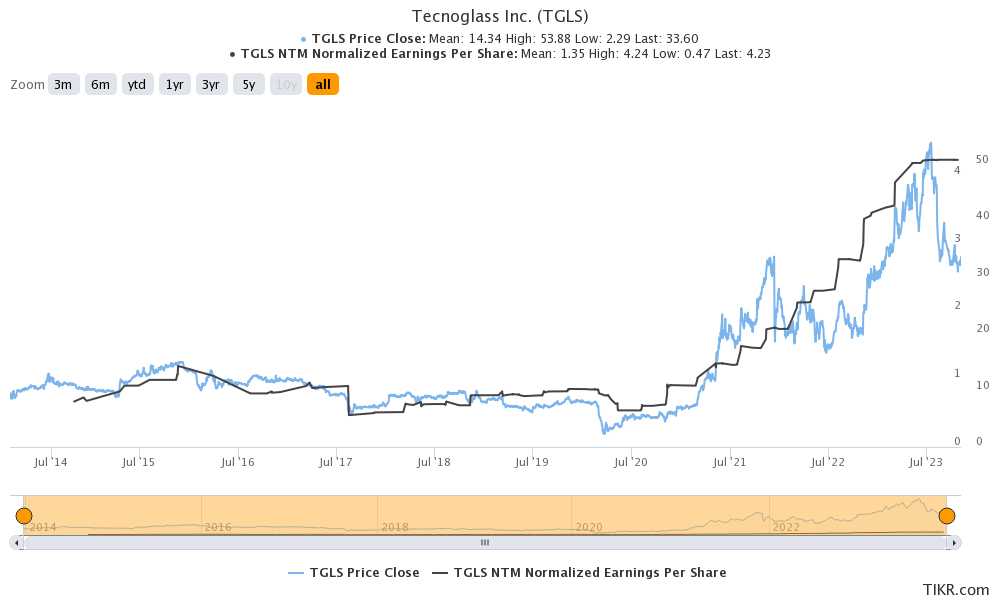
Note: I discovered Tecnoglass around July 2023 when the company was trading at approximately $30 to $35. While the company caught my attention due to the ‘simplicity’ of its business model and its sudden growth from 2021 to 2024, I initially didn’t pay much attention because of its performance trend from 2014 to 2020.
I continued tracking the company and saw a continue increase until 2025, which is when I finally decided to write this full review, and invest on this company.
Introduction
Tecnoglass, Inc. is a leading manufacturer and distributor of architectural glass, windows, and associated aluminum products for both commercial and residential construction markets. The company is headquartered in Barranquilla, Colombia, and operates internationally, with a strong presence in the United States, its largest market.
It markets and sells its products under the Tecnoglass, ES Windows, and Alutions brands through internal and independent sales representatives, as well as directly to distributors. The company was founded in 1984 and is headquartered in Barranquilla, Colombia. Tecnoglass Inc. is a subsidiary of Energy Holding Corporation.
Key Products and Services:
- Architectural Glass
- Laminated Glass: Combines multiple glass layers with an interlayer for safety and strength.
- Tempered Glass: Heat-treated for durability and thermal resistance.
- Insulating Glass: Enhances energy efficiency by reducing heat transfer.
- Low-Emissivity (Low-E) Glass: Coated to reflect heat while allowing light.
2. Windows and Aluminum Products:
- Windows and Door Systems: Designed for aesthetic appeal, energy efficiency, and impact resistance.
- Curtain Walls: Exterior cladding systems for large-scale commercial buildings.
- Storefront Systems: Glass systems for retail and commercial applications.
3. Specialty Products:
- Impact-Resistant Glass: Built to withstand severe weather conditions and meet hurricane safety standards.
- Custom Solutions: Tailored products for unique architectural designs and client needs.
Tecnoglass primarily serves the construction sector, catering to High-rise commercial buildings, Residential properties, including luxury homes and Infrastructure projects.
Competitive Advantages:
1. Vertical Integration: Tecnoglass owns and operates its manufacturing facilities, ensuring strict quality control, cost efficiency, and faster turnaround times.
2. U.S. Market Leadership: The company has a strong distribution network in the U.S., with significant market share in the Southeastern and Southwestern regions.
3. Innovation and Sustainability: Tecnoglass emphasizes energy-efficient and environmentally friendly products, aligning with growing demand for sustainable construction materials.
The main competitors of Tecnoglass are PGT Innovations, Inc. (PGTI), Apogee Enterprises, Inc, (APOG), and Cardinal Glass Industries (which is a private company) and these companies are part of the Industrial sector.
Market Growth
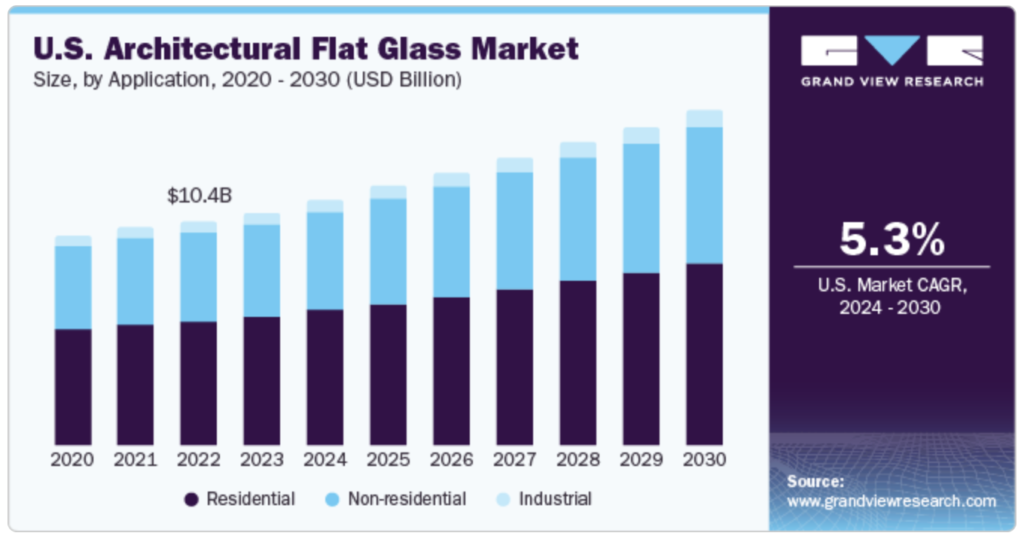
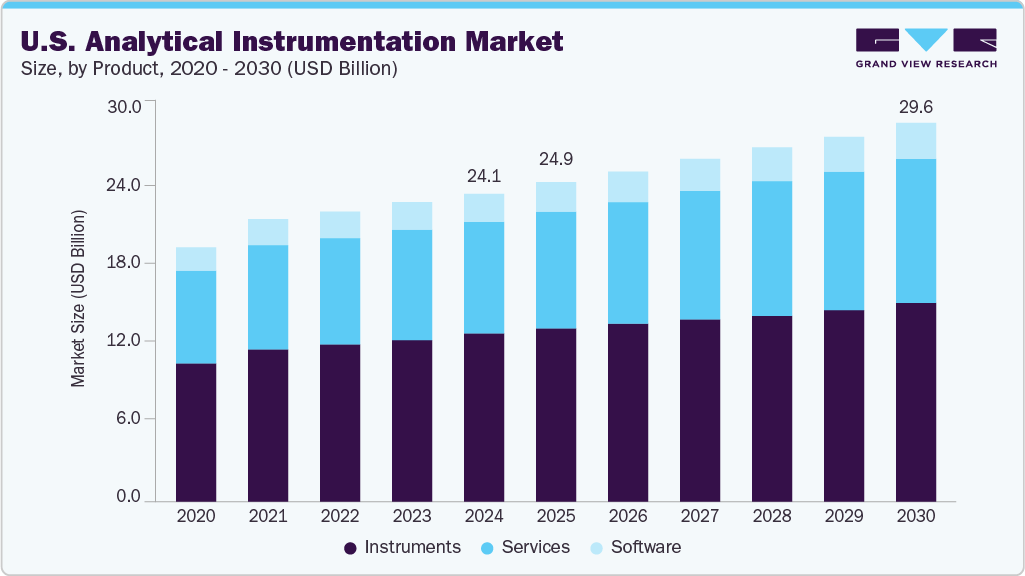
In the United States, the architectural glass market is expected to grow at a higher CAGR of 4.9%, from USD 572 million in 2023 to USD 802 million by 2030, supported by strong renovation activity and premium demand for low-E and impact-resistant products.
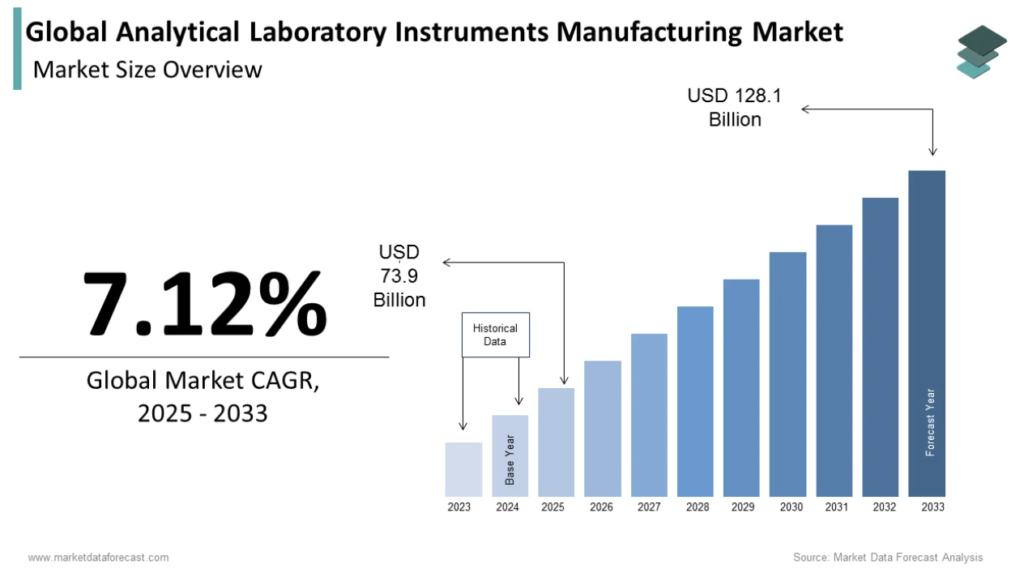
Other research firms show similar yet slightly more conservative trajectories. MarketResearch.com projects global architectural glass to grow from USD 219 billion in 2023 to USD 258 billion by 2030, corresponding to a ~2.8% CAGR.
Meanwhile, when the broader flat glass market (including automotive and solar applications) is considered, Grand View Research forecasts USD 311 billion in 2024 rising to USD 405 billion by 2030, a 4.6% CAGR, confirming the medium-term resilience of the category.
Key Risks and short-term headwinds
While the long-term outlook remains favorable, several short-term risks could weigh on demand.
The macroeconomic environment — especially high mortgage rates in the U.S. — has already begun to slow home improvement spending. A recent Financial Times article noted that homeowners are postponing major upgrades due to financing costs.
The Fenestration & Glazing Industry Alliance (FGIA) reported in 2024 that new-construction window demand grew ~1%, but replacement window demand fell ~5%, with another mild decline expected in 2025 before a rebound in 2026–2027 (FGIA Industry Review 2024).
Beyond macro factors, input-cost volatility (aluminum, PVC, logistics) and trade tariffs represent recurring threats to margins. Competitive pressure is also intensifying, as large incumbents (JELD-WEN, Andersen, Pella) streamline operations and pursue share in vinyl and energy-efficient categories.
Q2 2025, Consistency and Execution at record levels
Tecnoglass delivered another record quarter in Q2 2025, proving once again that operational excellence and disciplined capital allocation can outperform cyclical headwinds in construction.
Revenue hit an all-time high of $255.5M, up 16.3% YoY, with Adjusted EBITDA of $79.8M (+24.5% YoY) and margins expanding 200 bps to 31.2%. Gross margin improved to 44.7%, benefiting from stronger retail pricing, operational leverage, and a favorable FX tailwind as the Colombian peso weakened 7% versus the USD.
The company’s backlog reached a record $1.2B (+17% YoY) — 97% based in the U.S. — ensuring visibility well into 2026. The book-to-build ratio of 1.2x underscores sustained demand across multifamily and commercial projects, especially in high-end condos and luxury lodging where interest-rate sensitivity is lower.
On the residential side, single-family revenues grew 14.5% YoY to $109.6M, driven by expanding dealership networks, new showrooms, and strong traction in vinyl windows — a move that more than doubles Tecnoglass’ addressable market. Orders rose 29% sequentially, marking the second-highest quarter on record and reinforcing growth momentum into the second half of the year.
From a financial standpoint, Tecnoglass remains exceptionally strong:
- Net cash position: $28.7M
- Liquidity: ~$310M
- Net debt/EBITDA: –0.09x (no leverage)
- ROE (3yr avg): 39% vs 16% peers
- ROIC (3yr avg): 27% vs 10% peers
The company’s vertically integrated model — from glass manufacturing to installation — continues to be its structural moat, enabling industry-leading lead times (5–6 weeks) and resilient margins despite aluminum tariffs and labor inflation.
For 2025, management expects revenue between $980M–$1.02B and Adjusted EBITDA of $310M–$325M, with gross margins in the low-to-high 40% range. Even under conservative assumptions, Tecnoglass is positioned to sustain superior returns on capital and compound value over time.
Assessing the Upsides and Downsides of Tecnoglass: My Perspective
Tecnoglass has structurally upgraded its profitability profile. While 2021–2022 benefited from an exceptional demand cycle, the company’s normalized returns (25–30% ROE, ~28% ROC) suggest it retained most of those efficiency gains. This is consistent with a business that achieved scale, pricing power, and cost control — all signals of a growing economic moat.
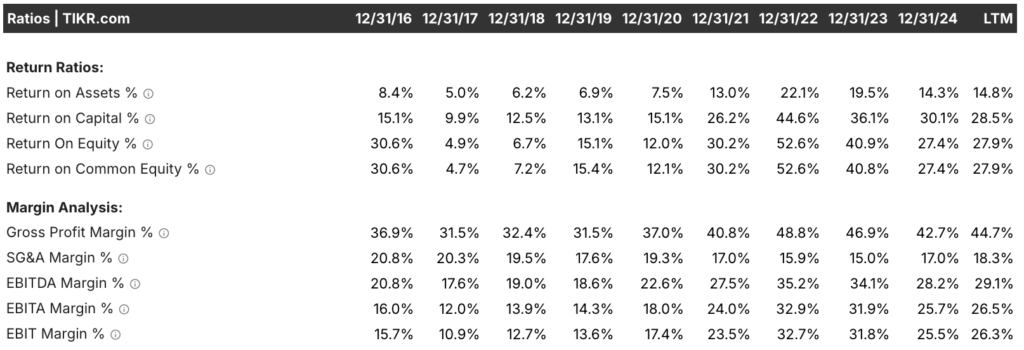
The margin expansion is structural, not cyclical. It results from (1) vertical integration, (2) efficiency in SG&A scaling, (3) dominance in U.S. distribution, and (4) product mix evolution (more premium vinyl and impact-resistant products).
The slight decline in 2023–2024 simply reflects normalization from extraordinary highs, not deterioration in fundamentals.
The sustained ROE >25% and EBITDA margins near 30% suggest a competitive advantage that goes beyond a short-term cycle.
The moat appears to rest on three pillars:
- Vertical Integration: Tecnoglass controls the entire value chain — from glass manufacturing to aluminum framing and installation — ensuring cost control, faster delivery, and superior margins.
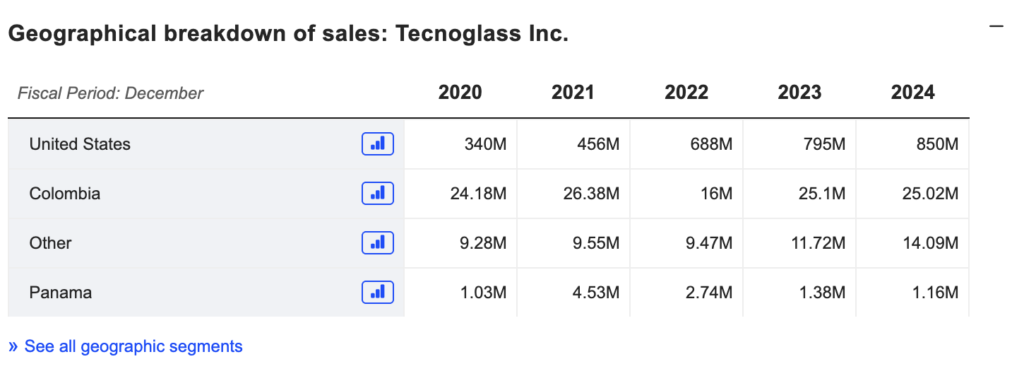
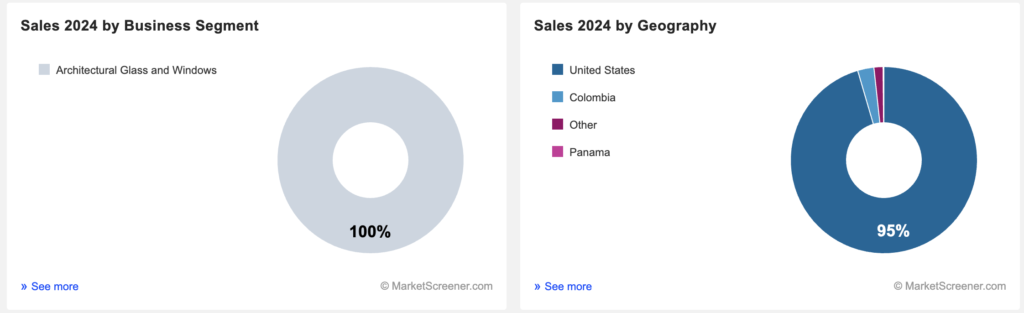
- Geographic Focus: 95% of revenue now comes from the U.S., particularly Florida and the Sun Belt, where code requirements (impact resistance, hurricane glazing) favor high-spec products.
- Operational Efficiency: The company’s production hub in Barranquilla offers structural cost advantages (labor, logistics, tax incentives) versus U.S. peers like Andersen or JELD-WEN.
These factors explain why margins remain high even as demand normalizes. In essence, Tecnoglass behaves less like a commodity manufacturer and more like a specialized premium supplier with pricing power and economies of scale.
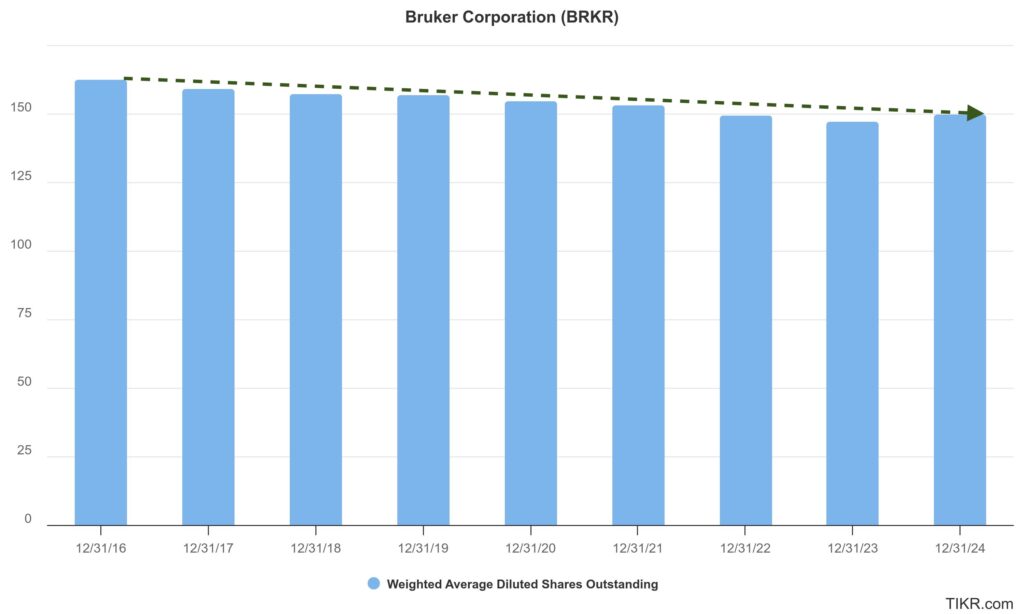
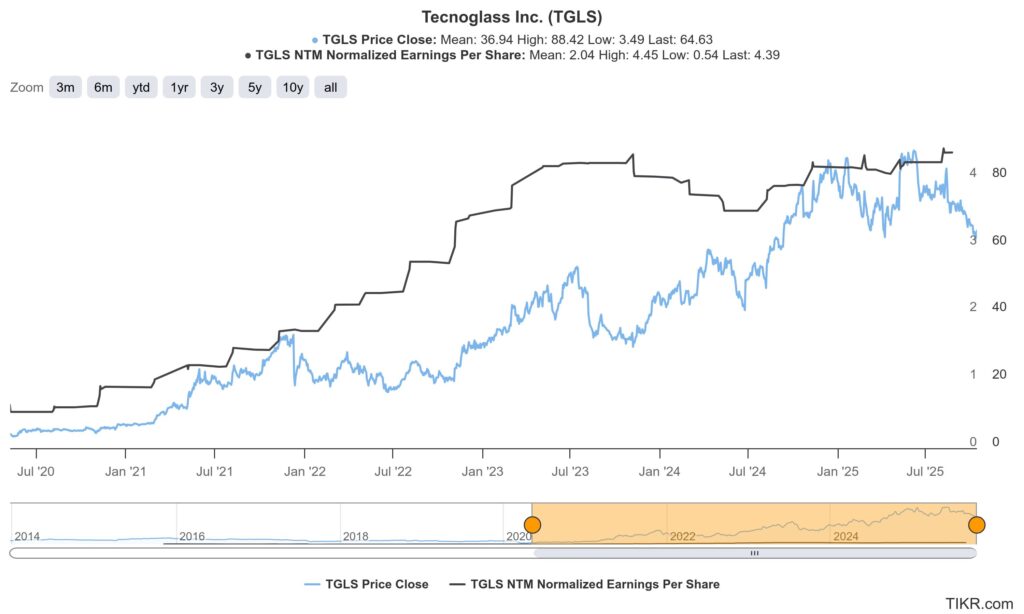
Inefficiencies between the price and its capacity to generate value, EPS has been growing since 2020, and the company is still reporting high earnings per share, but the price tanked in Jul 2023.
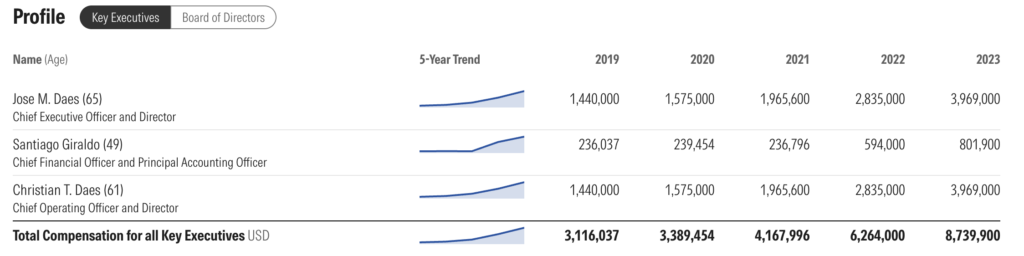
Leadership Analysis
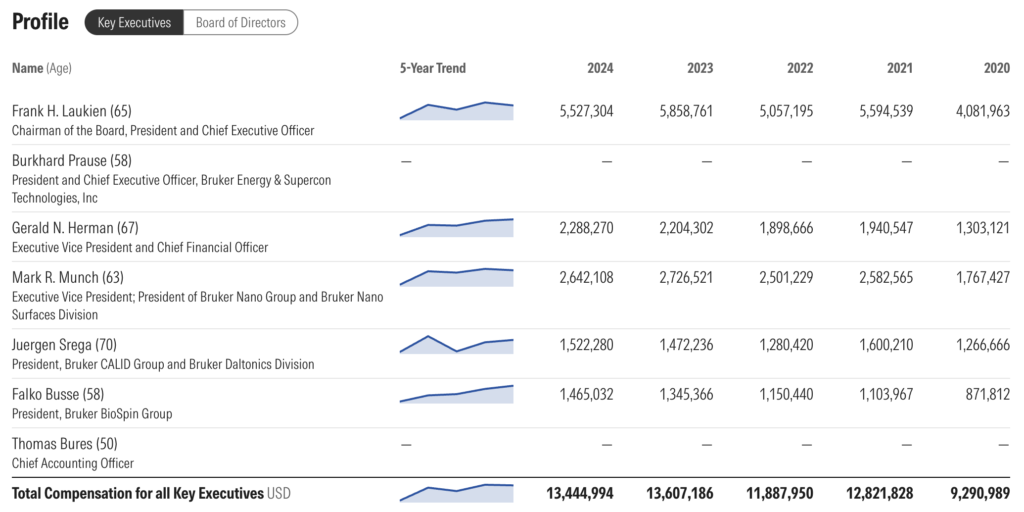
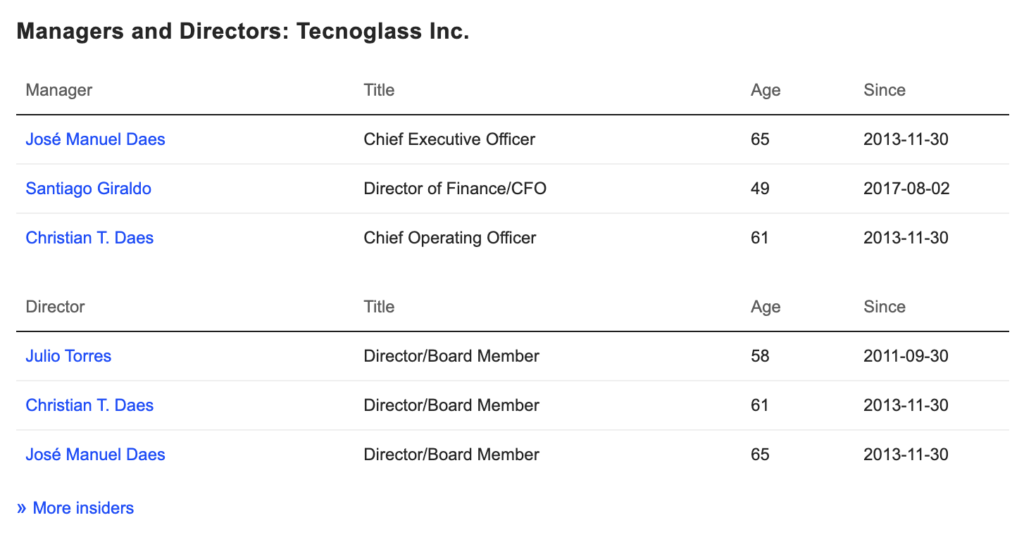
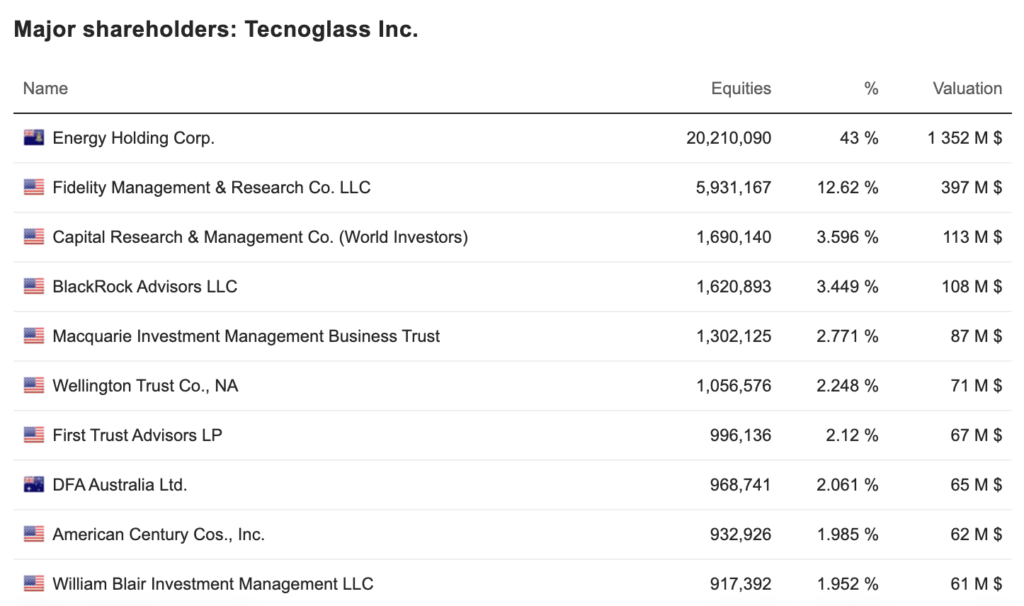
Tecnoglass was founded in 1984 in Barranquilla, Colombia, by the brothers José M. Daes and Christian T. Daes, and it was a family-owned business from the start. The company made its debut on the U.S. stock exchange through a business combination in 2013 and later moved its listing to the NYSE. However, the Daes family still holds a significant stake, primarily through Energy Holding Corporation. This entity owns roughly 43% of the outstanding shares (according to recent filings), which is a positive sign. Not only does it show that the founders, who serve as CEO and COO, maintain a key role, but the family retaining a large share conveys a strong alignment between their interests and the company’s long-term success.
The main reason why the owners of Energy Holding Corp are also the owners of Tecnoglass is because Energy Holding Corporation (EHC) is the entity through which the founding family of Tecnoglass, brothers José M. Daes and Christian T. Daes, maintain their majority stake in the publicly traded company.
Essentially, it is not that Energy Holding Corp owns Tecnoglass in a traditional “energy holding” manner, but rather that:
1.- José M. Daes (CEO and Director) and Christian T. Daes (COO and Director) are the founders of Tecnoglass.
2.- They and their family members are the indirect owners of Energy Holding Corporation (EHC).
3.- EHC is, in turn, the largest shareholder of Tecnoglass Inc., a company listed on the stock exchange (NASDAQ and/or NYSE, historically).
The ownership structure through Energy Holding Corporation generally serves a strategy of:
By consolidating their shareholding through a single entity (EHC), the Daes family can maintain significant voting control over the decisions of the board of directors and the strategic direction of Tecnoglass, even though the company is publicly traded and has other institutional and minority shareholders. This allows them to drive their long-term vision for the company.
Capital and Liquidity Management:
Company Financing: Initially, this structure enabled the creation and growth of the company.
Secondary Sales: Energy Holding Corp has made secondary offerings of shares (block sales) in the past. This is a way for the founding owners to obtain liquidity (cash) from their investment without Tecnoglass itself issuing new shares and diluting all other shareholders. They are simply selling a portion of their consolidated stake to the market.
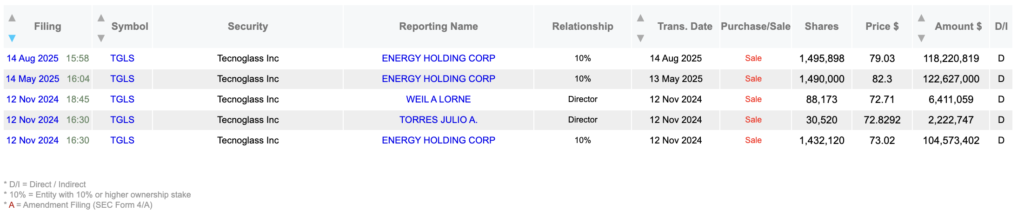
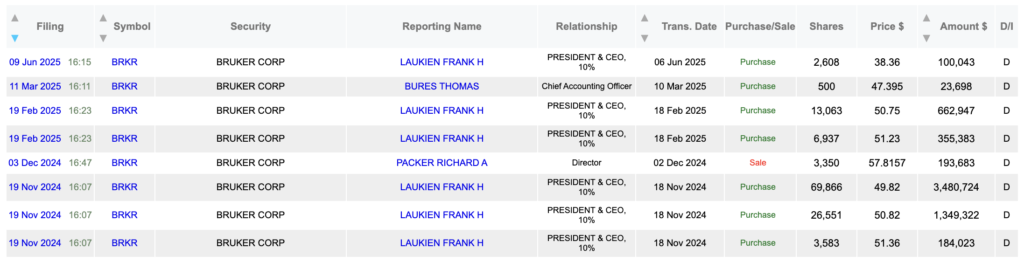
We have not identified unexpected movements or aggressive sales from the Executive team or board of Directors.
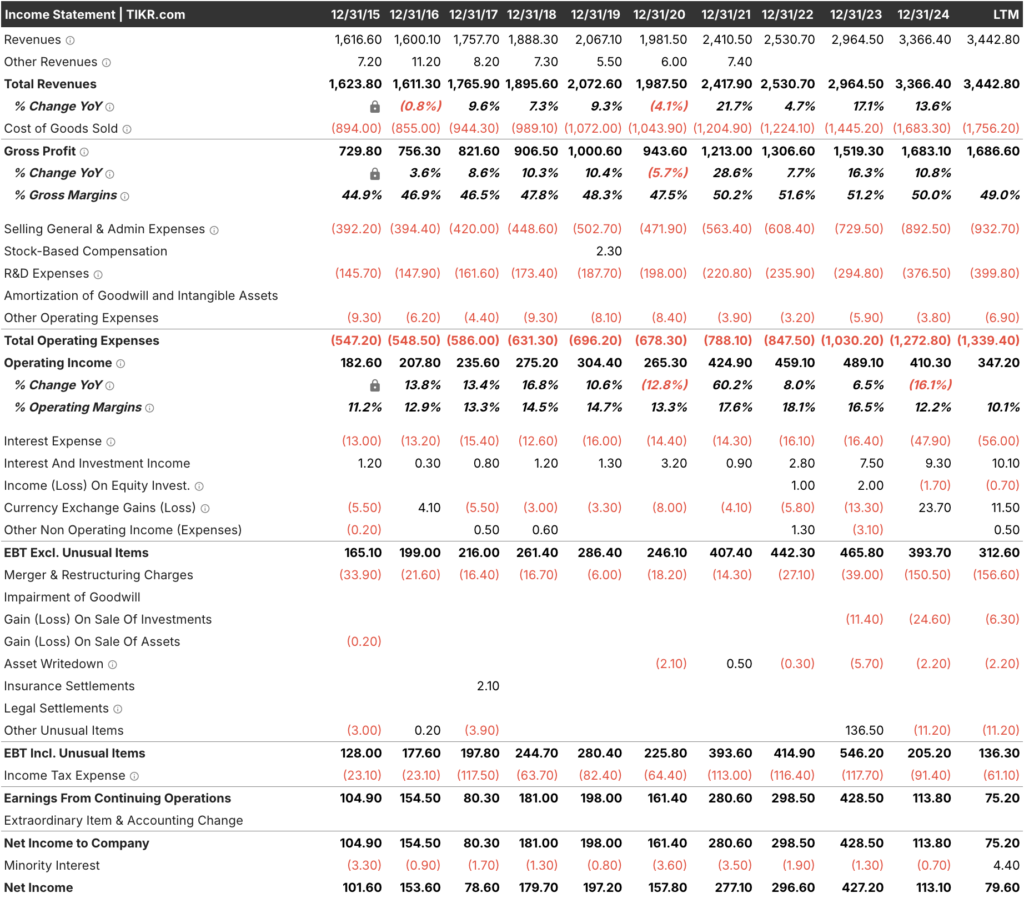
Financials
Income Statement
Accordin to the company: During the third quarter, the Company returned capital to shareholders through an aggregate of $30.0 million in share repurchases and $7.0 million in cash dividends.
In November 2025, the Company’s Board of Directors authorized the expansion of the Company’s share repurchase authorization to $150.0 million to execute during opportunistic times.
Management will have discretion in the repurchase of common shares, including the timing and amount to be repurchased. Following the expansion, the Company had approximately $96.5 million remaining under its existing share repurchase program.
Q3 2025 Results heavily impacts the stock price.
Following the Q3 results, I summarised the biggest insights in the following bullet points:
- Revenue of US$260.5 million, up 9.3% YoY. investors.tecnoglass.com
- Net income of US$47.2 million, or US$1.01 per diluted share. investors.tecnoglass.com+1
- Adjusted EBITDA of US$79.1 million (≈ 30.4% of revenues). investors.tecnoglass.com
- Record backlog of US$1.3 billion, up ~21.4% YoY. investors.tecnoglass.com
- Strong liquidity: ~US$550 million total liquidity including cash (~US$124 m) + credit facility (~US$425 m) with debt of US$111.9 m. investors.tecnoglass.com
- Expansion of buy-back: US$30 m share repurchase in Q3 + dividend US$7 m; and share repurchase program expanded to US$150 m. investors.tecnoglass.com
- Guidance updated: Full-Year 2025 revenue range revised to US$970-990 m and Adjusted EBITDA to US$294-304 m. investors.tecnoglass.com
On the surface, many things are going well: revenue growth, backlog growth, strong liquidity, shareholder capital returns, and improved strategic positioning. These are positive signals typically associated with a high-quality, possibly compounder business.
But, despite the strong headline, there are a number of caveats in the release and surrounding commentary that likely dampened investor enthusiasm:
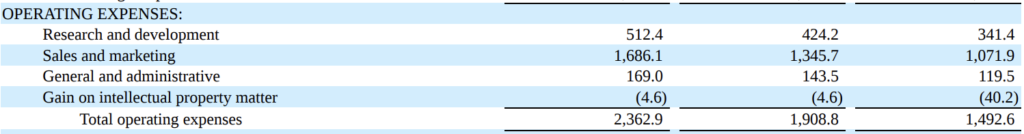
Margin pressure
- Gross margin fell to 42.7% in Q3 from 45.8% in the prior year quarter. investors.tecnoglass.com
- Adjusted EBITDA margin dropped to ~30.4% from ~34.2% the year ago quarter. investors.tecnoglass.com
- Management explicitly flags “higher raw material cost related to all-time high premiums for U.S. aluminium, and a revaluation of the Colombian Peso” as drivers. investors.tecnoglass.com
Interpretation: While growth is positive, margins are under pressure. For a business whose investment case hinged partly on margin expansion, any margin erosion triggers concern.
Single-family residential growth moderating
- Single-family residential revenues grew only 3.4% YoY compared to the higher growth in multi-family/commercial (14.3%). investors.tecnoglass.com
Interpretation: Since the single-family market is more sensitive to interest-rates, housing cycles, and consumer sentiment, the low single-family growth suggests some vulnerability.
Currency & mix headwinds
- FX headwinds from the Colombian peso revaluation. investors.tecnoglass.com
- Unfavourable revenue mix: higher installation content (which tends to carry lower margins than product sales) is cited. investors.tecnoglass.com
Interpretation: These factors imply that underlying margins might be under pressure beyond just cost inflation — mix and FX are structural headwinds.
Guidance seems conservative / lower than previously expected
- While management raised full-year guidance, the ranges (US$970-990 m revenue, US$294-304 m EBITDA) reflect only ~10% revenue growth and ~8% EBITDA growth at midpoint. investors.tecnoglass.com
- Some commentary from market watchers noted that the company “missed consensus expectations” despite the growth. Finimize+1
Interpretation: Investors often like not just growth, but upside surprise and margin improvement. When the guidance is conservative and margins contract, sentiment can turn even if absolute results are good.
Valuation reset / analyst target cuts
- Analysts have lowered price targets (e.g., DA Davidson cut TGLS target from ~US$95 to ~US$80. GuruFocus
- The stock hit new 52-week low despite results. MarketBeat
Interpretation: Analyst target reductions and technical breakdowns often trigger negative momentum. Even a good business can suffer share price weakness if growth/margin expectations are lowered.
Why has the share price dropped to below ~$50? (Putting it all together)
Bringing the above points into a cohesive narrative:
- Even though growth is positive, the margin contraction and cost/mix/FX headwinds suggest that the “best-case” scenario (continuous margin expansion) may be under threat. For a stock that previously traded on high return metrics and margin improvement, this is a material shift.
- The single‐family residential slowdown, in a business where that segment is meaningful, introduces cyclical risk — fear of interest‐rate pressure, housing market softness, and renovation hesitancy.
- The guidance, while positive, is not aggressive; investors may have been expecting more upside or margin improvement rather than stability. The fact that it reflects only ~8% EBITDA growth (in a business that previously delivered much higher growth) may disappoint.
- Analysts and the market are re-pricing the risk: margin pressures + cyclical exposure + cost inflation = higher risk premium. So the valuation multiple is compressing.
- Technical and sentiment factors: hitting a 52-week low often spurs investor caution; when analysts cut targets, this can become a self-reinforcing negative spiral (sell side lowers target → investors sell → share price falls → more negative sentiment).
- The business remains fundamentally strong, but the “promise” of continued margin expansion and high growth might be being recalibrated; investors sometimes rotate out before the new metrics embed.
Valuation

The analysis shows that the current share price of TGLS is $46.55, while the calculated intrinsic value is approximately $78.71, with a 30% a margin of safety, it will recommend a purchase price at $55.10.

Based on the analysis performed, I consider TGLS to be undervalued in terms of its intrinsic value, given that the current share price is below its calculated value. scena
However, it is essential to note that growth projections are optimistic and may not materialize. The company shows a solid return on capital and good growth potential, but investors should be cautious about expectations.